|
B. Geerts |
7/'98 |
![]()
Why estimating rainfall from space ?
Precipitation is a crucial link in the hydrologic cycle, and its spatial and temporal variations are enormous. A knowledge of the amount of regional rainfall is essential to the welfare of society. Rainfall also drives the hydrological cycle, and to improve weather and climate predictions, an accurate global coverage of rainfall records is necessary. Raingauge data are available on land only, mainly in densely populated areas, and little offshore information exists.
Rainfall can be estimated remotely, either from ground-based weather radars or from satellite. Radars are active devices, emitting radiation at wavelengths ranging between 1 and 10 cm, and receiving the echo from targets such as raindrops. The maximum range of radars is only about 300 km, so offshore coverage is limited. Also, radars are prohibitively expensive in the Third World. Satellite-based measurements offer global coverage or a good part thereof.
Geostationary satellites (IR/visible)
With the advent of geostationary weather satellites in the 1960s and 70's, positioned above the equator at 5-6 positions around the globe to provide complete coverage, various techniques have been developed to estimate rainfall from visible and infrared (IR) radiation upwelling from the Earth into space. The higher the cloud albedo, the more droplets and/or ice crystals it contains and the deeper it tends to be, so the more likely rainfall is on the ground. And the lower the IR brightness temperature, the higher the cloud top, and the more likely the rainfall. A combination of both channels works best (1). Imagine a fair day with cirrus clouds, for instance. The IR channel may flag this as wet, because of the cold cloud tops, however cirrus is optically thin, so in the visible channel it is dry.
The visible/IR rain retrieval algorithms work best at low latitudes, because at higher latitudes the view is more slanted, confusion arises with high-albedo surfaces of snow or ice, and deep-convective precipitation is less common. Another problem is incomplete pixel filling for small cumulonimbus clouds (2).
At night no visible imagery is available. One can then use an empirical relationship between cloud-top temperature (deduced from the outgoing radiation in the 10.7-micron waveband), the simultaneous precipitation rate inferred from surface radar reflectivity, and the humidity profile (derived from radiosonde data). The rainfall rate (R mm/h) depends on the cloud-top temperature (T degrees Kelvin) thus (2):
R = 1.1183 x 10¹¹ x exp ( - 3.6382 x 10⁻² x T0.5)
Adjustments are then made according to the precipitable water and surface relative humidity. The rate of change of cloud-top temperature can be used as well. It indicates the speed of cloud growth, and hence the areas of heavy rainfall.
In practice, the procedure allows useful estimates over 6 hours periods. However, it overestimates rainfalls over 24-hours in the case of slowly moving thunderstorms with a broad anvil, by exaggerating the area of rainfall. On the other hand it underestimates rainfall from warm-top stratus, especially near coastlines and in mountainous terrain. In short, quantitative precipitation estimates from geostationary satellites can yield cumulative rainfall and thus flood warnings, for instance, because of the continuous coverage, but large discrepancies with raingauge data occur.
SSM/I
Since 1978 one or more passive microwave sensors have been available on polar orbiting satellites, such as the Special Sensor Microwave/Imager (SSM/I) on the Defense Meteorological Satellite Program (DMSP). In most areas, including the tropics, most rainfall results from cold clouds, i.e. clouds with ice aloft. The microwave emissivity of ice is much higher than that of liquid water, so at least over the oceans cold clouds can be easily detected by the SSM/I. This has led to an improved global precipitation climatology.
TRMM
|
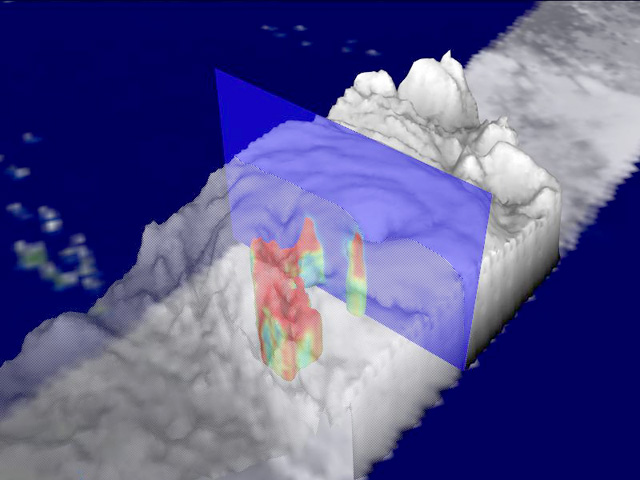
In November 1997 the TRMM (Tropical Rainfall Measuring Mission) satellite was launched (3). This satellite carries all the above (passive microwave, infrared, and visible), plus an active radar. This combination provides a far superior estimate of rainfall within 35° from the equator. The Figure on the right shows a 3D slice through tropical cyclone Susan east of Fiji (the green specks on the left in the image) on 19 May 1998. The grey background is based on IR and visible data, the colours within are radar reflectivity. |
|
Except for TRMM,
satellite-based precipitation retrieval techniques perform poorly in complex terrain, because low-level, topographically forced updrafts may trigger heavy rainfall. For instance, the annual rainfall on Mt Waialeale on the island of Kauai, Hawai'i, is nearly 10 m, yet the cloud tops rarely are above -10° C.
References