Determining cloud cover

E. Linacre and B. Geerts

1/'98


The amount of cloud cover at various levels (low, middle and high) can be estimated from satellite data. For instance, Fig 1 shows the estimated global cloud cover from simultaneous observations on a series of geostationary satellites around the world (Note 8.J). Because the image is infrared, the brightness of the clouds is a measure of their heights.

Cloudiness can be calculated by counting the number of cloudy pixels on the satellite image, and this can be done for a large sample, to obtain climatologically meaningful estimates. These satellite-based estimates are generally less than ground-based ones, either by direct human observation or by inference from the duration of bright sunshine (1). The sunshine duration leads to an overestimate of cloudiness when the sun is close to the horizon (before sunset or after sunrise), especially when the cloudiness is cumuliform. Direct human observation attempts to compensate for the apparent obscuration of clear sky near the horizon, by the vertical extent of intervening low and middle clouds, but still most ground-based observers tend to overestimate cloudiness in these circumstances.

Compared to satellite estimates, human observations overestimate cloudiness by about 0.2 -0.0013f tenths of cloud (where f is the latitude in degrees), e.g. 0.15 tenths at 40°. This is because cumuliform clouds are more common at lower latitudes. Note that apart from using ‘okta’ units of cloudiness (i.e. eighths of the sky covered by cloud), we may express the fraction in ‘tenths’. In other words, 4 oktas equals 5 tenths.

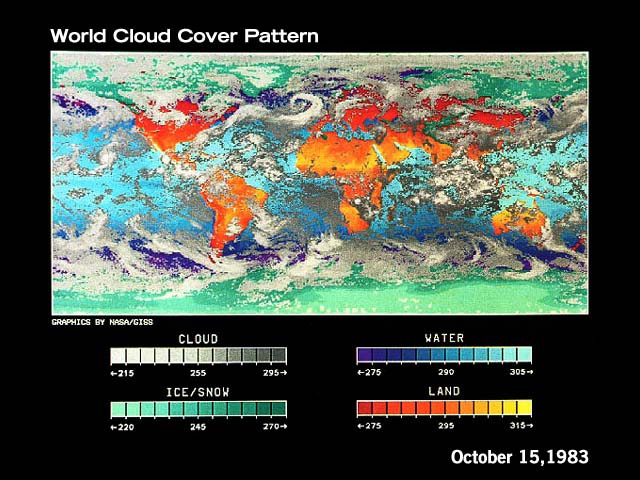
Fig 1. Global cloud cover at 12 GMT on 15 October 1983, as estimated from infrared imagery on 5 geostationary meteorological satellites. The shadings are a function of the IR brightness temperature. (Source: NASA/GSFC)

Complications arise from the fact that thin cirrus would not be seen by the satellite nor influence sunshine-recorder readings, but are apparent to the ground observer. Also, the ground observer sees a much smaller area of sky at any moment, and the size of this area depends on the cloud base height. And near the horizon, the solar intensity is too weak to actuate a sunshine recorder, especially under hazy conditions.

The value of long-term trends of cloudiness suffers from the rather local character of the observations, and from the possible systematic biases between individual surface observers. Therefore value is added to time series of human observations by corroborating them by means of all-sky photographs (2) or satellite imagery, which has been available only for the last few decades.

Fig 2: Average total cloud cover in Australia, based on human observations, from 1957 to 1996 (4).

A significant increase of cloudiness between 1910-1989 appears to have occurred in Australia (3). A more recent analysis (4) confirms a slight increase over the past four decades but show that it is largely due to an abrupt change in the early 1970s (Fig 2). Most of the rise apparently has occurred in winter and spring. Reported changes in cloud cover elsewhere are generally small and often inconsistent.


References

  1. Moriarty, W.W. 1991. Cloud cover as derived from surface observationns , sunshine duration, and satellite observations. Solar Energy 47, 219-22.
  2. McGuffie, K. and A. Henderson-Sellers 1988. Observation of oceanic cloudiness. Eos 69, 715.
  3. Jones, P.A. and Henderson-Sellers, A. 1992. Historical records of coudiness and sunshine in Australia. Journal of Climate, 5, 260-267.
  4. Plummer, N., Nicholls, N., Lavery, B.M., Leighton, R.M. and Trewin, B.C. 1997. Twentieth century trends in Australian Climate Extremes Indices. In: CLIVAR/GCOS/WMO Workshop on indices and indicators for climate extremes, Asheville, NC, USA, 3-7 June 1997.