Solar radiation and surface temperature
|
E. Linacre |
1/'99 |
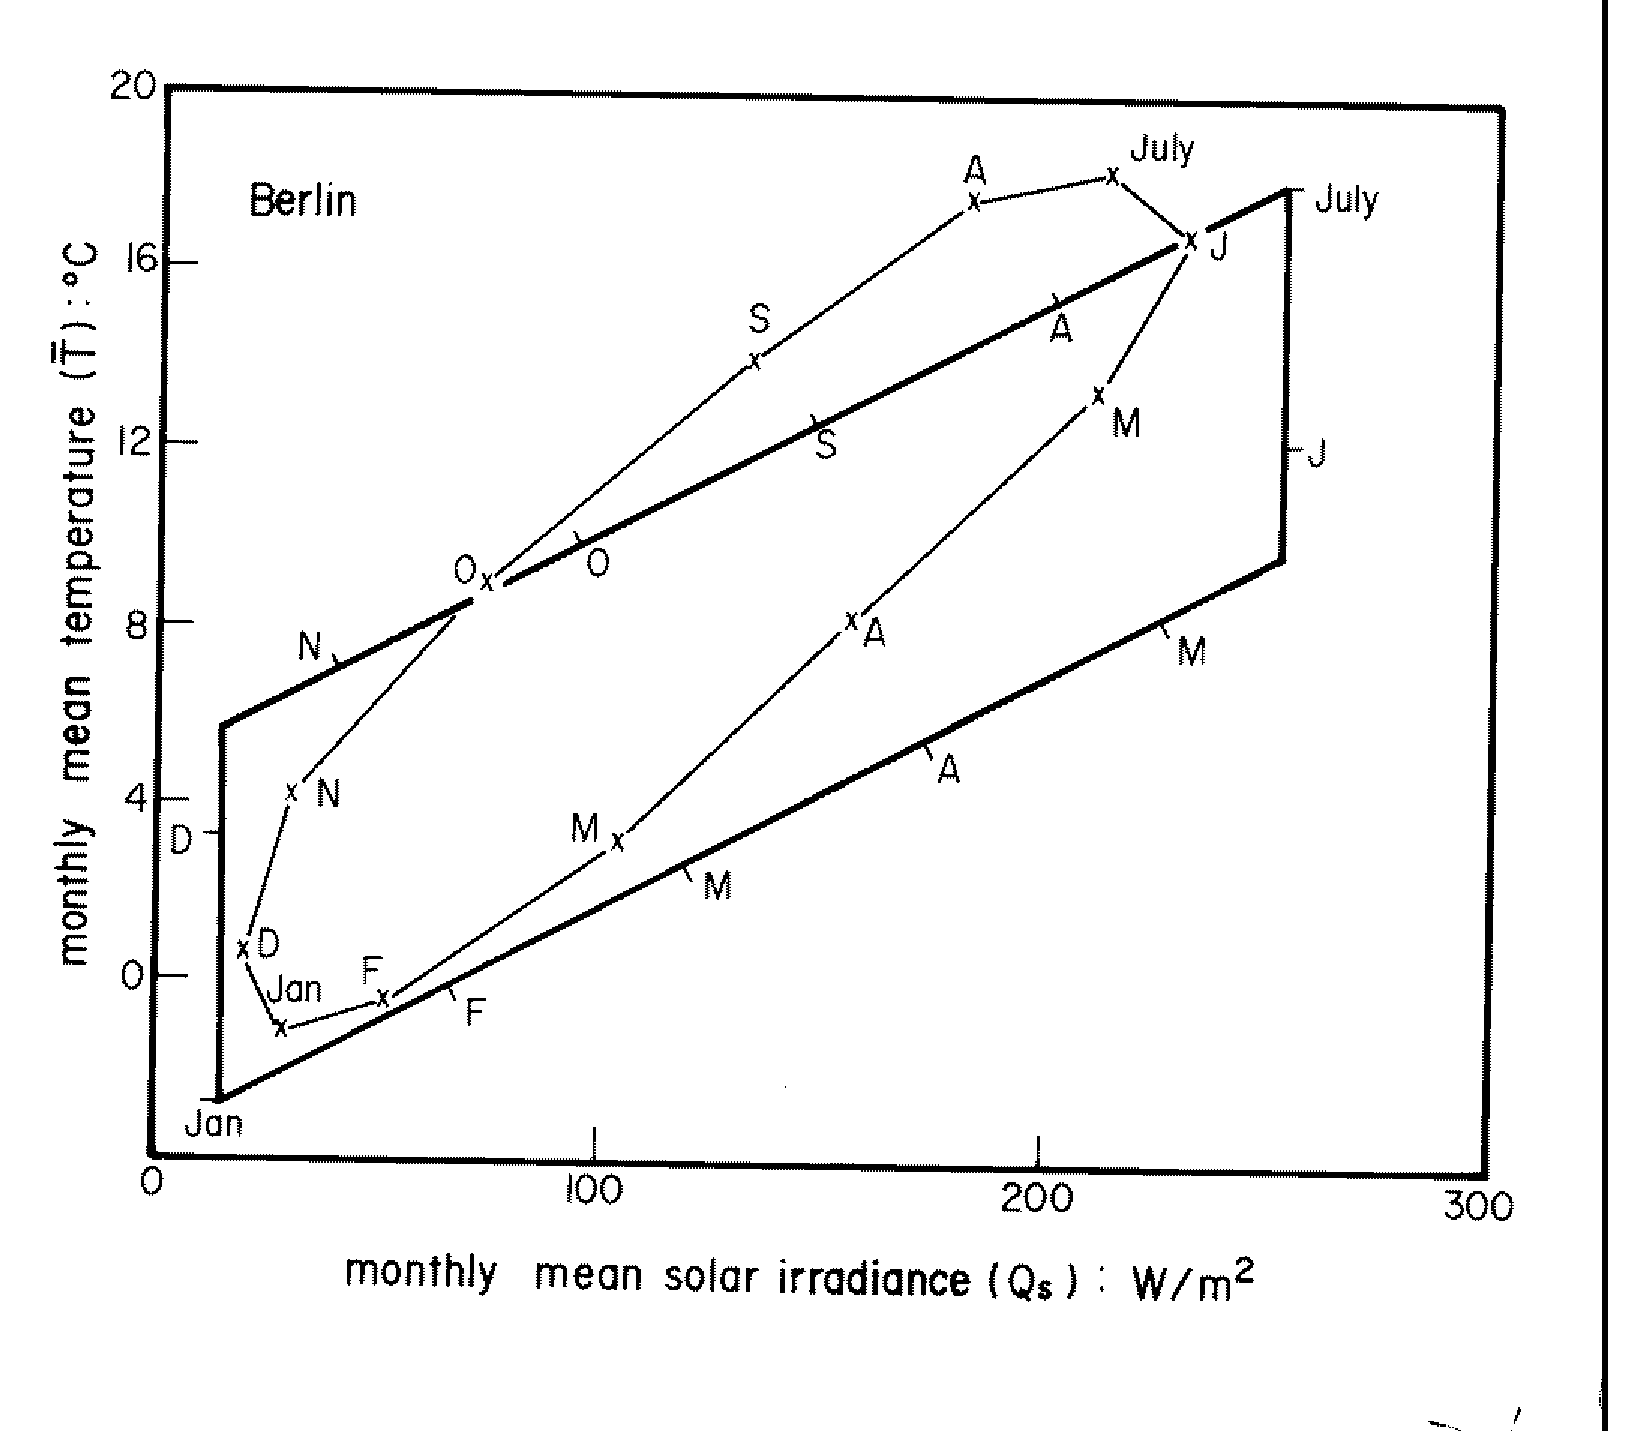
The annual cycle of surface temperature lags that of incoming solar radiation by one or two months. Therefore the curve of solar radiation against temperature is a loop (hysteresis), as shown in Fig 1 for monthly mean values in Berlin. An idealised hysteresis is shown as a prism with equally spaced tickmarks. In making these marks, it was assumed that the highest temperature and most radiation occurred in July (in the northern hemisphere). However some places have August (or February) as the warmest month, esp places along a coast with prevailing onshore flow.

Fig 1. Annual loops of monthly mean values of incoming solar radiation and air temperature at Berlin. The prism (in bold) is an estimate, approximating the irregular loop formed from measured values. The letters indicate months of the year.
In a monsoonal climate the loop does not look like a prism. Changes of advection and rainfall complicate the assumed dominant effect of radiation on temperature (1). The maximum temperature there typically occurs a month or two before the summer solstice. Also, estimates go awry at latitudes and elevations where ice forms, altering the albedo of the surface, and hence the proportion of the solar radiation available for heating the surface.
However, for a large fraction of the world the prism is a good approximation. There the marks on the estimated prism provide usefully accurate monthly mean values of both radiation and temperature in places without measurements. Then these values allow estimation of rates of evaporation of water, for instance, as in this paper (2).
The five empirical relationships required to draw the prism connect
- annual mean sea-level temperature Ta against latitude L,
- temperature Tz against elevation z (km),
- annual range of temperature Rt against distance inland d (km),
- annual mean solar radiation Qa against latitude, and
- annual range of solar monthly mean solar radiation Rq against latitude.
They are as follows -
|
Ta = 44.9 [cos( L - 6.5)]2 - 17.8 |
° C |
(i) |
|
Tz = Ta + 6 z |
° C |
(ii) |
|
Rt = 0.13 L d 0.2 |
° C |
(iii) |
|
Qa = 210 + 1.8 L - 0.06 L2 |
W/m2 |
(iv) |
|
Rq= 60 + 4 L |
W/m2 |
(v) |
These are considered at length elsewhere (3, 4).
References
(1) Linacre, E.T. 1970. Global-radiation intensity and screen temperature at various places. In S.P. Chatterjee and S.P. Das Gupta (eds) 21st Internat. Geog. Cong. 1968, Delhi, Selected Papers 1, ((National Commisssion Geog. Calcutta) 307-11.
(2) Linacre, E.T. 1993. Data-sparse estimation of lake evaporation using a simplified Penman equation. Agric. and Forestry Meteor. 64, 237-56.
(3) Linacre, E.T. 1969. Empirical relationships involving the global radiation intensity and ambient temperature at various latitudes and altitudes. Archiv. Meteor. Geophys. Bioklim. B12, 1-20.
(4) Linacre, E.T. 1992. Climate Data and Resources (Routledge) 366pp.