Gabor Vali - September 24, 2003
Two plots are presented for each of three circles: 0801-0831, 1106-1136 and 1416-1446 UTC. These circles are designated as RL in the DYCOMS overview document. The first and last were flown at about 2600m and the middle one at 1070 m MSL.
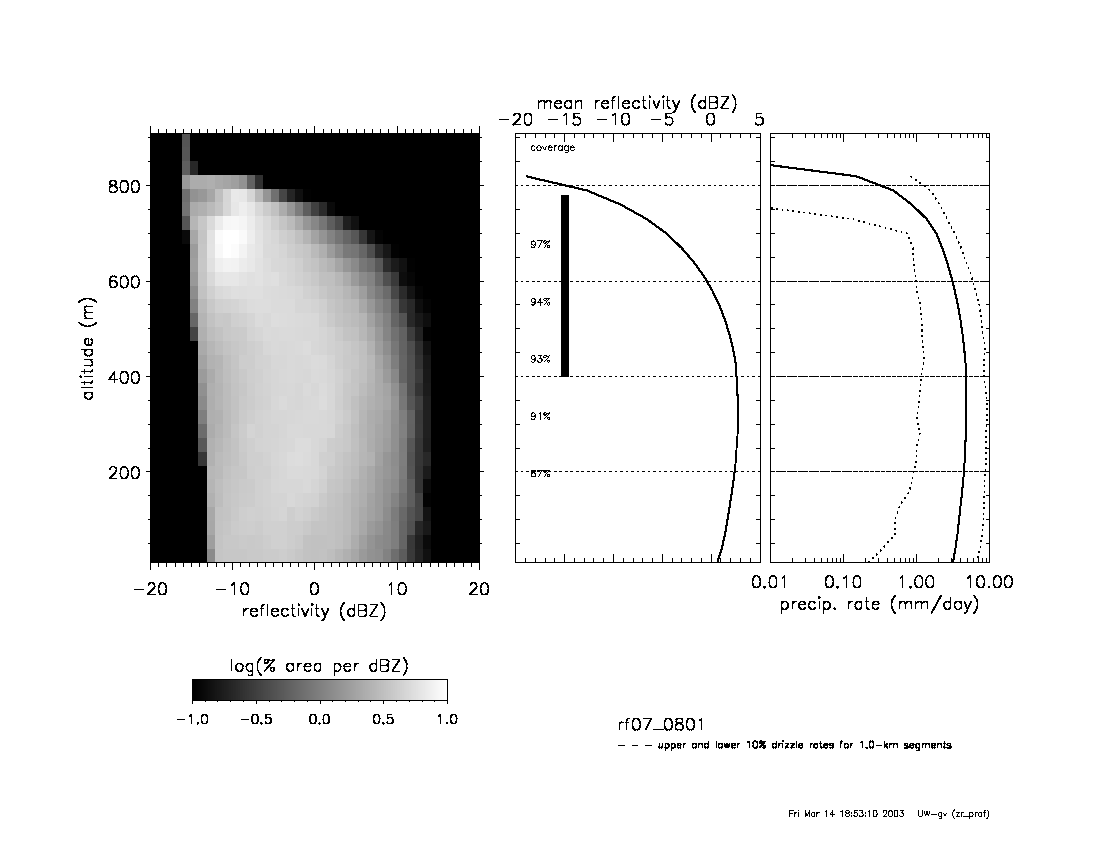
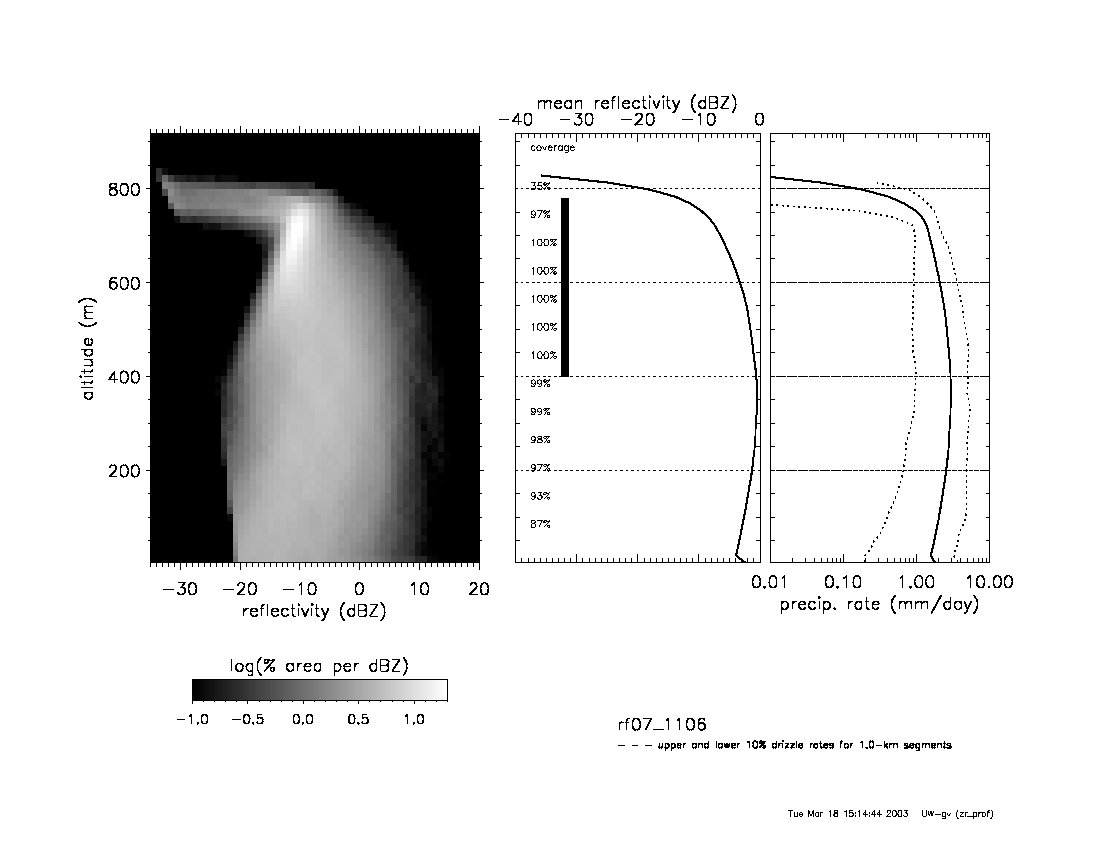
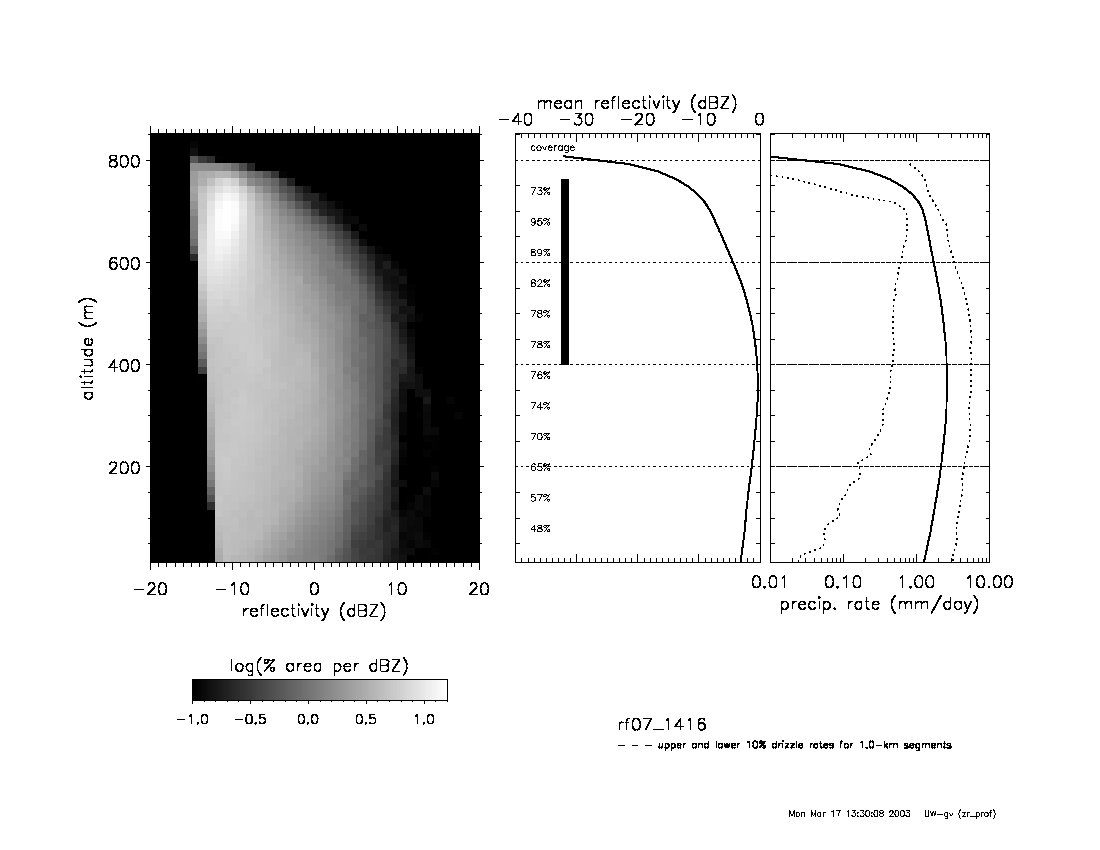
The "zr_dens" graphs show (i) the frequency of reflectivity values at each altitude in the form of a grayscale image, (ii) the mean reflectivity profile and (iii) the reflectivity converted to drizzle rate using a fixed (altitude independent) Z-R relationship.
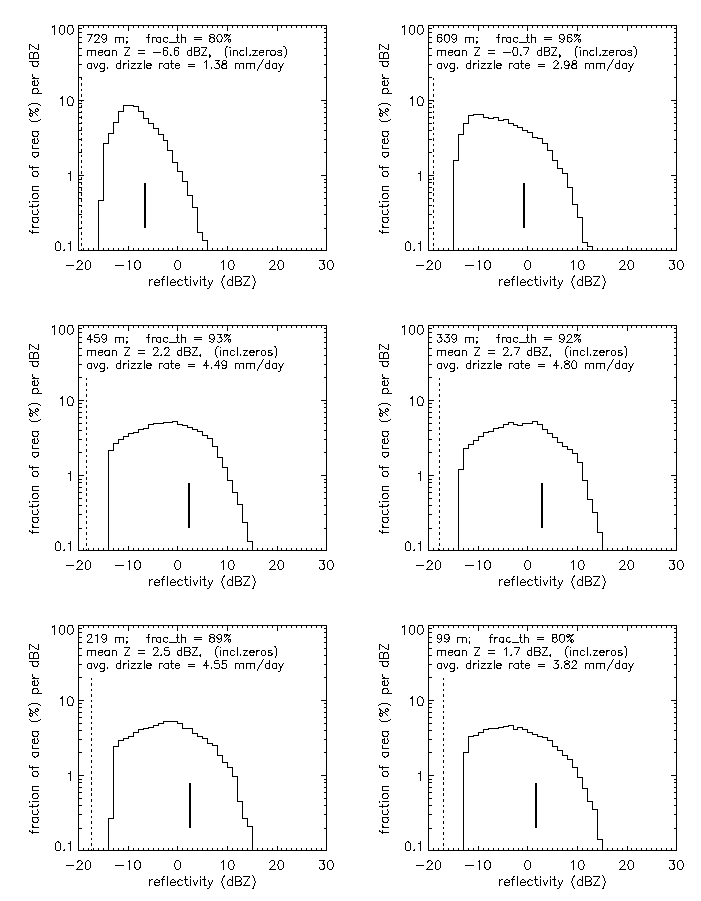
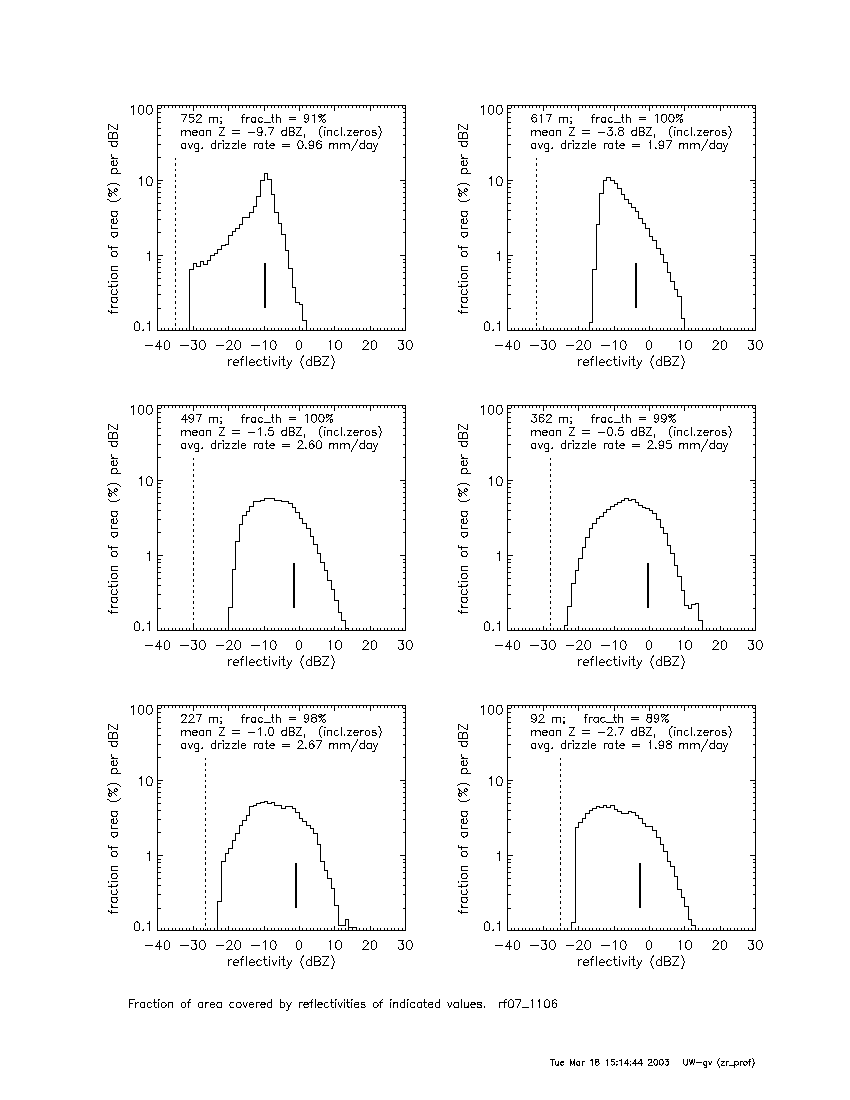
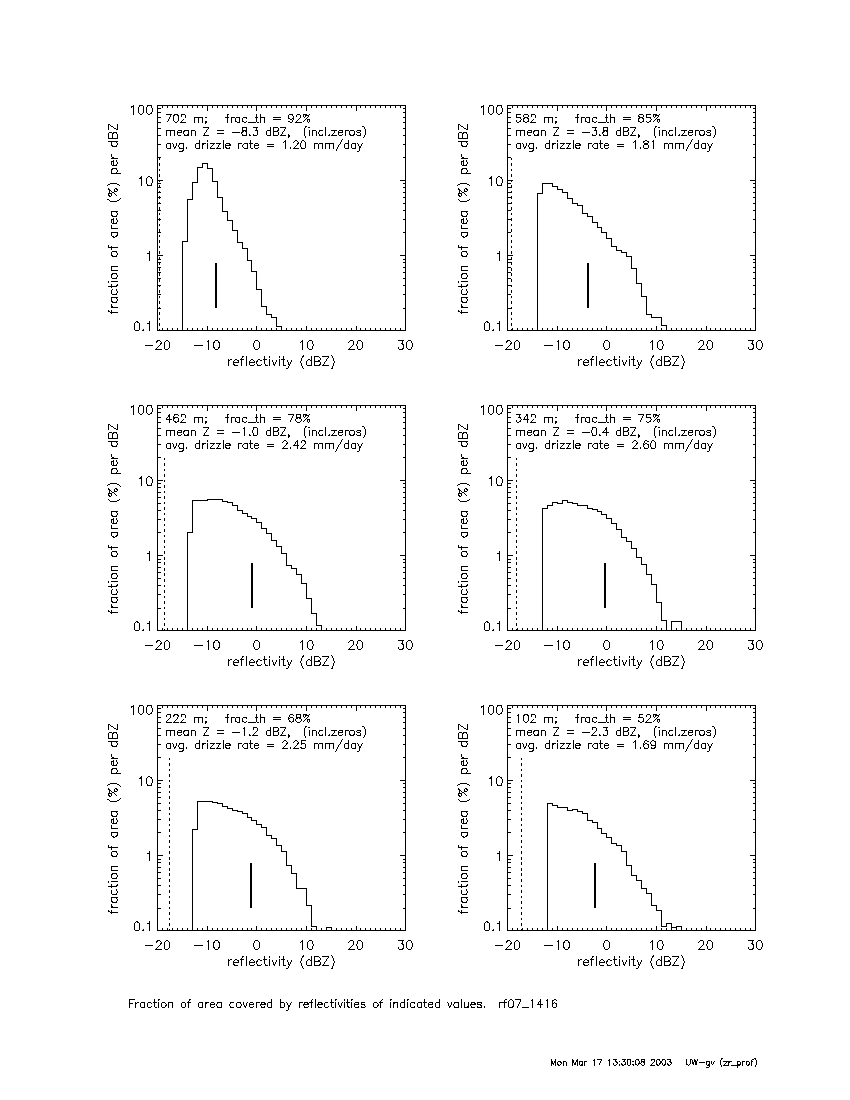
The "zr_hist" graphs show histograms of reflectivity at selected altitudes.
RL1, 08:01-08:31 UTC: zr_dens zr_hist
RL2, 11:06-11:36 UTC: zr_dens zr_hist
RL3, 14:16-14:46 UTC: zr_dens zr_hist