|
E. Linacre |
1/'99 |
The last Glacial Maximum (LGM) occured around 25-16 kBP and its coldest period was at 21 kBP. A GCM simulation incorporating the changes of
Earth-Sun geometry, carbon-dioxide concentrations, deep-ocean circulation, sea level and extent of the ice sheets (esp. over E. Canada and NW Europe), showed that global temperatures were on average 5.6 K colder than the mid- 20th century (1). This cooling is of the same magnitude as other estimates, mainly those from ice cores.Tropical temperatures were only 2.2 K below current values. However the temperature was much lower in the north Atlantic on account of a weaker and more shallow thermohaline ocean (conveyor belt) circulation there. The northern hemisphere cooled slightly more than the southern hemisphere, on account of the albedo feedback of the large continental ice sheets (1).
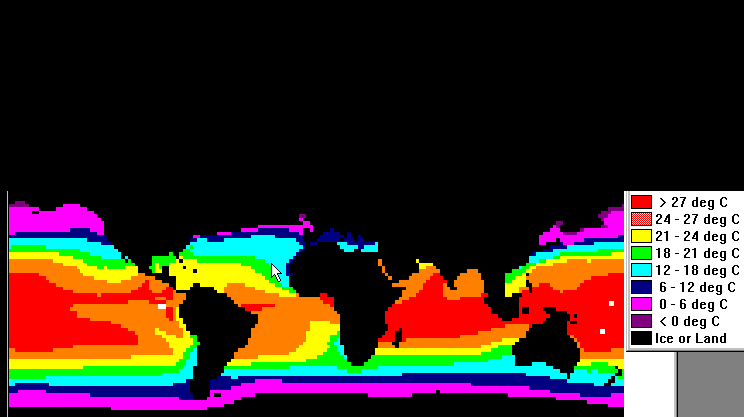
An international project, CLIMAP, was started in 1984 (2), to reconstruct past climates, in particular that of the LGM. One product of this project is the mapping of sea-surface temperature, based mainly on cores drilled in the seabed (Fig 1). The pattern in Fig 1 compare well to the GCM simulation (1). The cooling (compared to now) is larger at high latitudes, but even in the tropics the SST was 1-3 K lower than today. Therefore the area with SST>27° C was smaller, especially in the Atlantic, and therefore the threat of hurricanes was much reduced.
Fig 1. Mean surface temperature during the LGM, in February (top) and August (bottom), as estimated by the CLIMAP project (3).
A patch of the Pacific north of New Zealand was warmer during the LGM than nowadays, especially in summer, but a much larger region south and west of Australia was 5 K or more colder (4). Temperatures along the coast of New South Wales were 3-4 K cooler than now, whereas other evidence shows that the Southern Tablelands and Snowy Mountains were as much as 9 K colder than at present.
The rapid global warming around 13kBP cannot be explained by changes of ocean circulation nor changes of ice-sheet area or changes of Earth-Sun geometry. It seems more likely due to
CO2 concentrations, which were as low as 180 ppm during the LGM, in other words the warming was an instability within the coupled atmosphere-ocean-biosphere.Another
GCM simulation, incorporating the same variants mentioned above, indicate that it was 3-4 K warmer during the Pliocene (4 million years ago) and about 2 K warmer during the last interglacial (the Eemian) between135-115 kBP (5). (The comparison is against 1950 conditions, when it was about 0.5K cooler than now.) The Eemian temperature estimate is consistent with that from ice cores.
References