Wind farms
|
E. Linacre and B. Geerts |
2/’02 |
![]()
The power that can be generated from wind (Pw) is expressed in the same units as radiation and other surface heat fluxes, i.e. W/m2. This is because the amount of power that a parcel of air (of unit volume) moving at a speed U can transfer to a windmill depends on its energy (r.U2/2) pushed through the rotor blades per unit time (Dx/Dt or U). So:
|
Pw ~ r.U3 |
(which has units of W/m2) |
This is an instantaneous value only. Electricity companies are interested in a steady source of power. Clearly the mean wind power is less than the power derived from the mean wind, because of the cubic relationship. In other words the variability is at least as important as the mean wind. Note also the dependency on air density r: air at higher elevations or higher temperatures is less dense, so less power can be generated. But by far the main criterion for efficient wind energy generation is a steady strong wind.
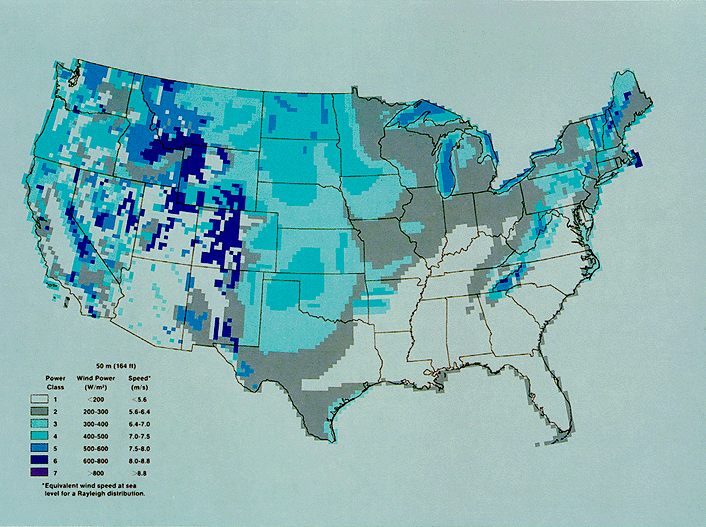
From the perspective of the electricity companies, it is unfortunate that the strongest winds are over the oceans. The most consistently powerful winds tend to be westerlies at about 55ºS. There the average energy density exceeds 1200 W/m2 in some areas. In contrast, the density averages about 200 W/m2 in the middle of the Atlantic at 25ºN, or less than 100 W/m2 on the equator west of Ecuador and over almost all of Australia. The windiest places on land or typically near the coast or near wind-enhancing terrain features such as ridges and mountain passes. In the USA the Great Plains areas and ridges and gaps in the Rocky Mountains experience more than 300 W/m2, whereas the Southeast has little wind, due to the Bermuda high (Fig 2).

Fig 2. Annual average wind resource estimate for the contiguous United States (in W/m2).
Areas can be classified according to their wind resource value, according to Table 1. Most land areas are in categories 1-3, and electricity generation becomes feasible in cat 4 areas. The Tehachapi Pass in Southern California is of cat 6 and Casey, a station along the Antarctic coast, classifies as cat 7 (Section 16.3).
|
Wind power class |
Wind power density (W/m2) |
Mean wind speed (m/s) |
|
1 |
0-100 |
2 |
|
2 |
100-150 |
4.4 |
|
3 |
150-200 |
5.1 |
|
4 |
200-300 |
5.6 |
|
5 |
300-400 |
6.0 |
|
6 |
400-1000 |
7.0 |
|
7 |
>1000 |
9.4 |
Table 1. Classification of wind power density, which can be used to compare locations. The average wind power density is based on the entire spectrum of observed 10m winds for a location, not just its mean wind speed.
|
Wind farms are in operation in California, Wyoming, Texas, Minnesota, northwestern Europe, and India. The picture on the right shows part of the largest commercial wind farm, on Tehachapi Pass in Southern California. It produces up to 1,300 megawatts of power, enough to supply power to half a million homes. Several wind farms are in operation along the North Sea coast from the Netherlands to Jutland, Denmark. The cost in Denmark, for instance, is almost as low as the cost of power from coal-burning plants, i.e. US 2c/kWh. In 1996 over 6,000 MW of electrical energy was extracted from the wind, globally. Currently a wind farm is being built on a hilltop at Crookwell on the Southern Tablelands of New South Wales, Australia. This area has been found to have fairly consistent winds. A large expanse of flat, open country allows the development of strong flows, which are then accelerated by hills. It is expected that eight wind turbines, each with two 22 m rotor blades on top of a 40 m tower, will typically generate almost 5 MW of electricity, enough for 3,500 homes. That will reduce the demand for coal-generated power plants, which emit greenhouse gases. |
|
Siting a wind farm
Prospecting for wind energy requires scores of wind monitors on temporary towers, measuring wind speeds and turbulence year-round (1). A 'good' site has consistent, medium-strength winds. Extremely strong winds can damage the propellers of the wind turbines. The height of the generators is a trade-off between the cost of a tall tower and the increasing wind speed (and decreasing turbulence) with height. A wind farm of the size worth connecting to a power-line grid needs to be fairly large, allowing numerous generators located 50-100 m apart.
Locating a good site near in New South Wales followed an initial study of the paths of the cold fronts across southern Australia, since fronts mean wind. Then historical and anecdotal information was sought, concerning windy regions. The windiest in Australia include the south coast, fronting strong south-westerlies, and also mountain ridges and peaks inland. This information informed the placing of the monitors. Data from them was used in a computer model of local topography and winds to identify 'sweet spots'. Lastly there were detailed measurements in cleared areas at those spots, to define the exact location of each wind turbine. Based on this climatological evidence, as well as practical arguments, Crookwell was selected as the best site.
Reference
(1) Coppin, P. 1998. Where's the best site for a wind generator? Sheet No. 8 (CSIRO Land & Water, Commonwealth Scientific & Industrial Research Organisation, Australia), 4pp.
