|
B. Geerts |
10/'98 |
![]()
The color we see depends on which colors are reflected and which are absorbed. When we look down upon the ocean, we generally see blue colours, because the ocean reflects the skylight which is primarily blue. However there are many different shades, sometimes tending to green or red, and these variations reveal the presence and concentration of phytoplankton, as well as sediments and dissolved organic chemicals.
Phytoplankton are single-celled ocean plants, less than 1 mm in diameter. These plants contain the chemical chlorophyll. Plants use chlorophyll to convert sunlight into food using photosynthesis. Phytoplankton is important, especially to the ocean fishing industry, because it forms the beginning of the food chain for all ocean fauna. Phytoplankton is important also in the global carbon cycle, and therefore the global climate, because the phytoplankton, or organisms higher in the food chain, sink to the ocean floor when they die. The carbon in the phytoplankton is soon covered by other material sinking to the ocean bottom. In this way, the oceans act as a sink of global carbon.
Because organic matter usually disappears in the depth of the ocean and in sediments on the ocean floor, life in the oceans is generally deprived of nutrients, and its abundance is limited by nutrient concentrations. Nutrients (minerals and organic matter) are abundant near coasts and river outlets. Upwelling waters also have high concentrations of nutrients, because these waters originate near the ocean floor. Therefore the most productive fishing areas are generally near river outlets, and where upwelling occurs, i.e. along certain coasts and in equatorial areas where Trade winds produce upwelling.
Because different types of phytoplankton have different concentrations of chlorophyll, they appear as different colours to sensitive satellite instruments such as the Sea-viewing Wide Field-of-View Sensor (SeaWiFS) (1), which observes a series of wavelengths in the visible and near-infrared spectra. The resulting 'ocean colour' image allows us to estimate the amount and general type of phytoplankton in that area, and tells us about the health and chemistry of the ocean.
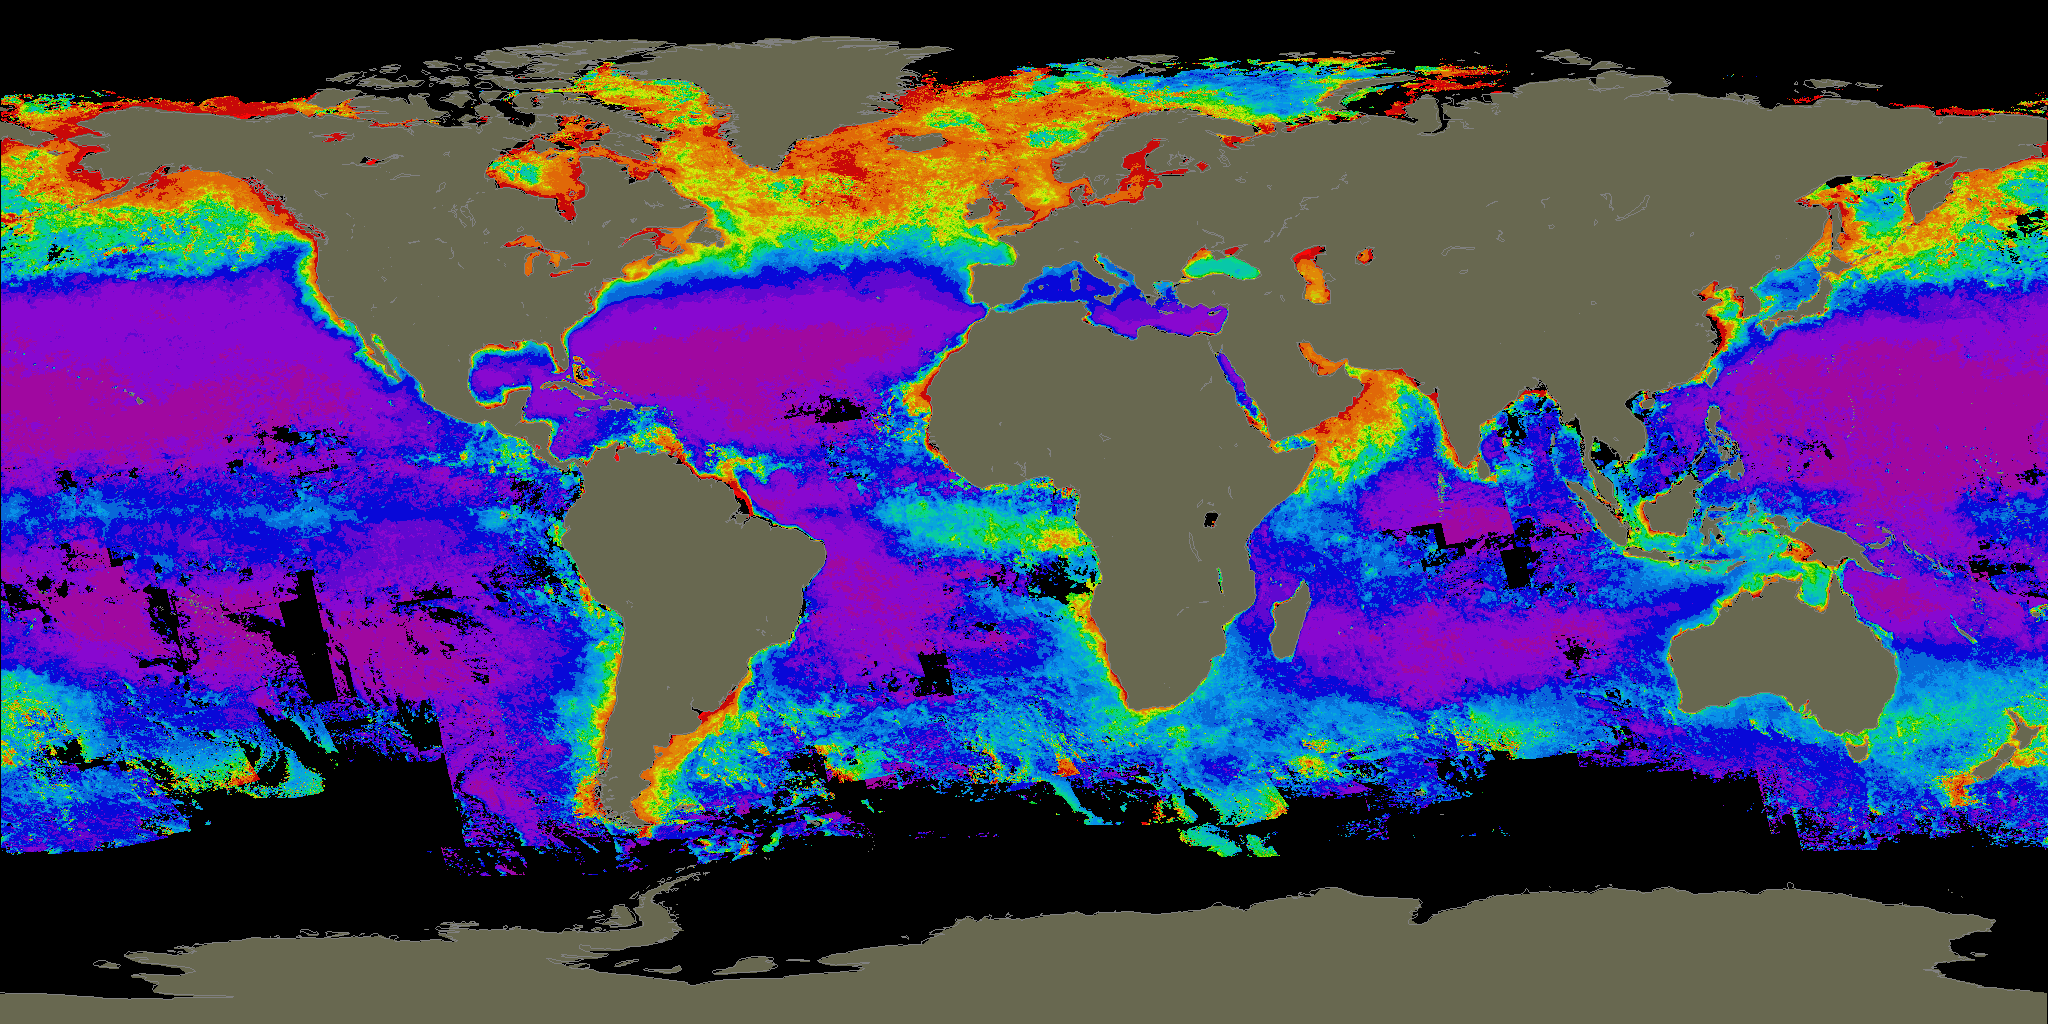
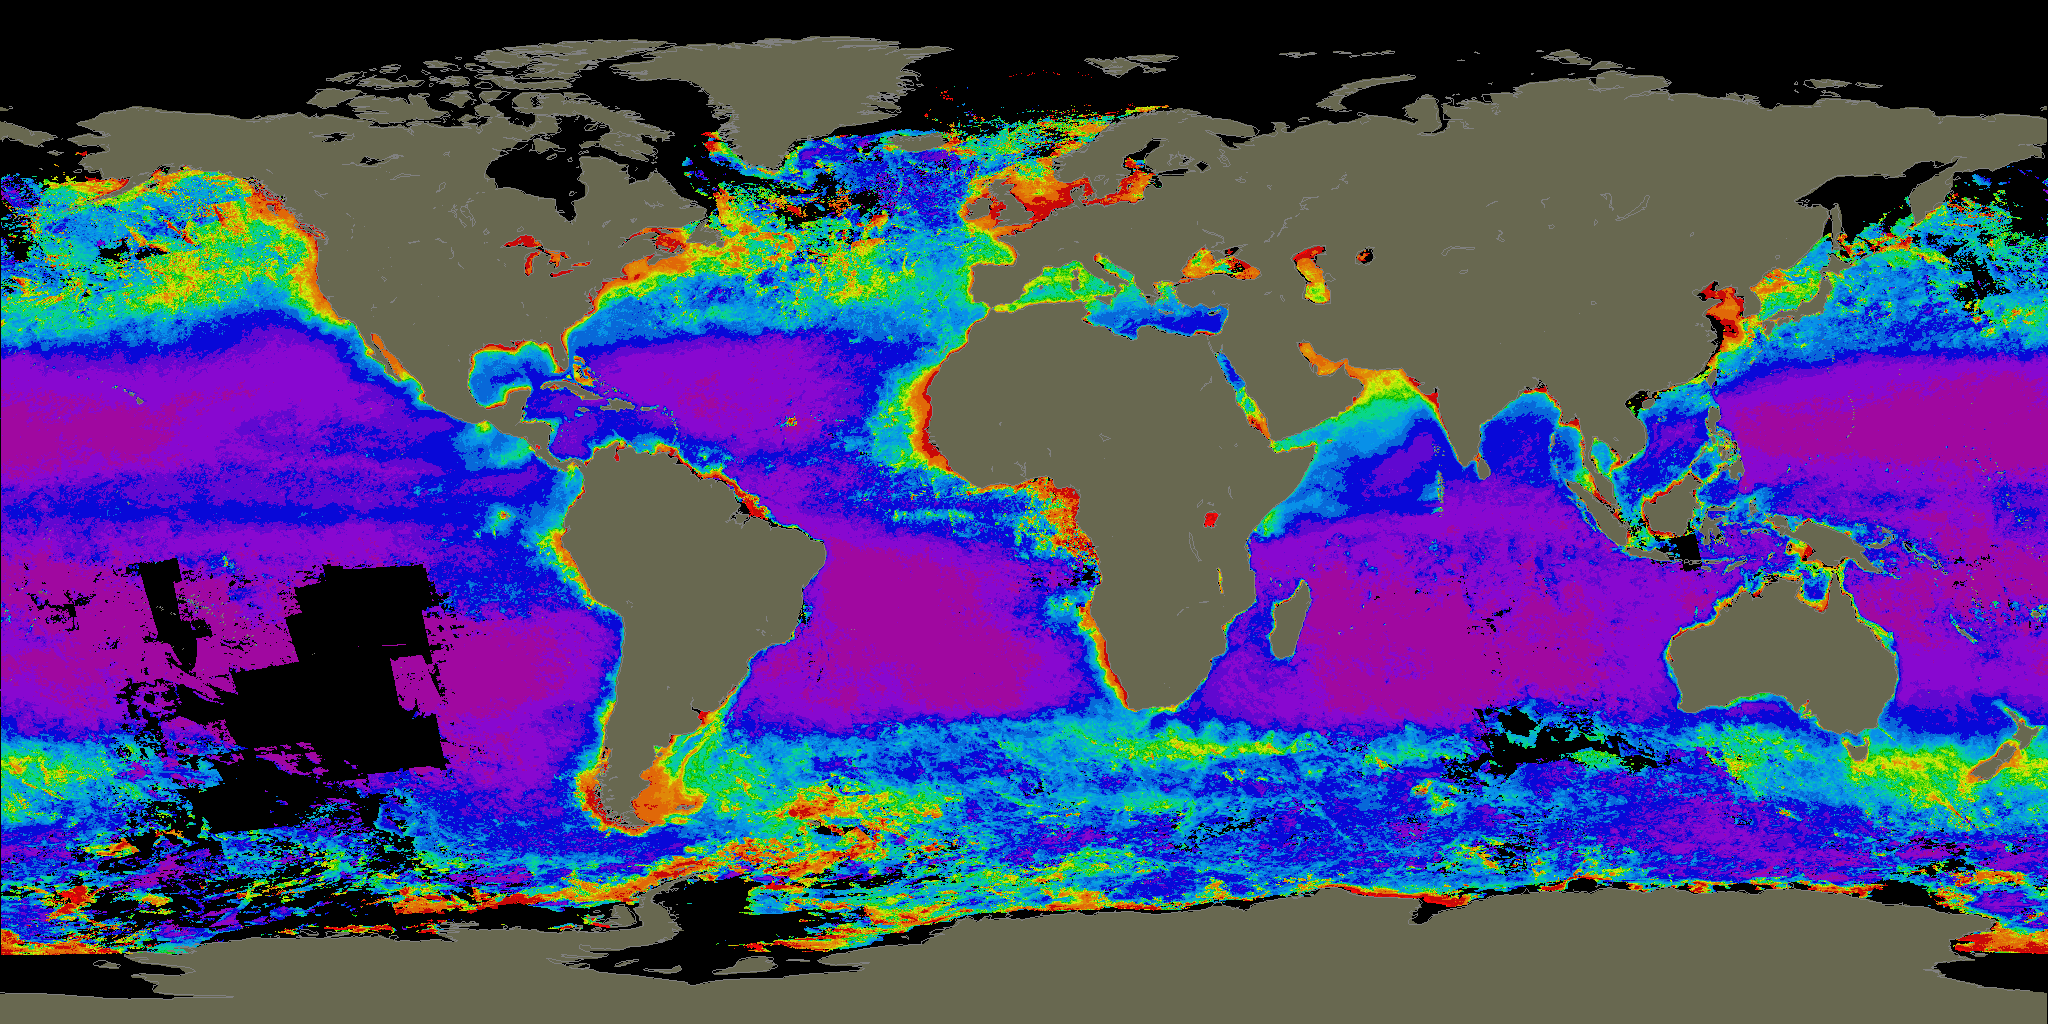
Comparing images taken at different periods tells us about changes that occur overtime. For instance, compare the global mean ocean colour in the austral winter (July through August) to that in summer (January through March) (Fig 1). The productivity is higher in summer at high latitudes, because of the melting of ice and (in the northern hemisphere) the run-off from arctic rivers.
|
|
|
|
Fig 1: Global mean 'ocean colour' (chlorofyll concentration) in the period July-August (left) and January-March (right) (courtesy NASA/GSFC). |
|
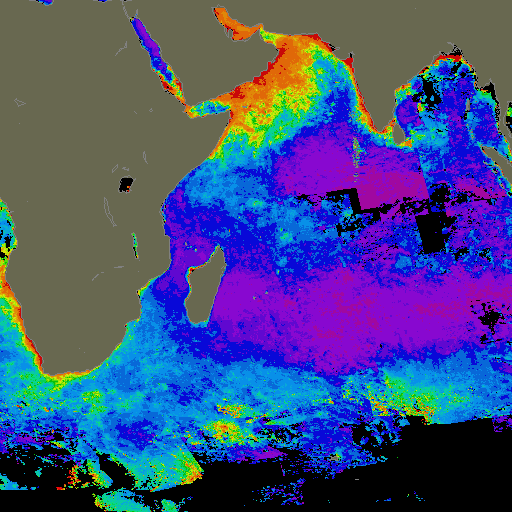
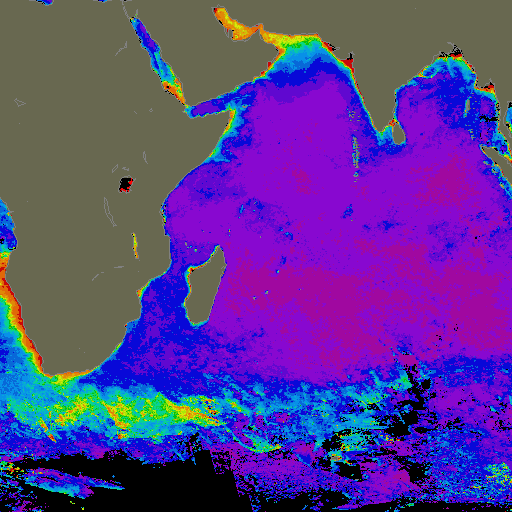
The effect of seasonal variations in upwelling can also be seen in Fig 1, for instance in the Arabian Sea. A more detailed image is shown in Fig 2. During the Indian monsoon (July-Sept) a southwesterly wind blows through the Arabian Sea, causing upwelling south of the Arabian peninsula. In winter and spring the upwelling is suppressed by a prevailing easterly wind.
|
|
|
|
Fig 2: Composite image of 'ocean colour' of the Indian Ocean in September-October, towards the end of the Indian summer monsoon (left), and May-June, towards the end of the winter monsoon (right) (courtesy NASA/GSFC). |
|
Reference
(1) The SeaWiFS project.