Tropical cyclones and El Niño's
|
B. Geerts |
3/'99 |
![]()
The changes of sea surface temperature and tropospheric winds during an El Niño lead to alterations in the frequency of tropical cyclones (TC), not just within the Pacific but also in other tropical oceans.
Central Pacific
An El Niño tends to increase their frequency in the central Pacific (160° E to 140° W) (Section 13.5, Fig 13.15) in both hemispheres, for instance by 70% at Tahiti (at 18°S,149°W), and by 100% at Kwajalein (at 10°N,168°W). This is due to higher SSTs and lower wind shear across the troposphere (1). Also, tropical cyclones tend to originate a bit closer to the equator, because the sea surface warming is focused on the equator, but this change is statistically less significant (2). Data on the tropical cyclones in the South Pacific during 1964-94, between Tahiti and Australia, indicate that their annual number is higher than average by 14-27% in years when the annual mean SOI is either unusually high or unusually low (3).
Atlantic
|
The season of Atlantic hurricanes, i.e. all those that form in the north tropical Atlantic and adjacent seas, starts in early June and ends in mid December. An average of 9.8 named tropical storms forms each year, but significantly fewer in seasons following an El Niño, especially if the El Niño continues well into the northern hemisphere summer (Fig 1). The reduction is largest in the Gulf of Mexico and the Caribbean Sea, for instance the odds of a hurricane hitting Puerto Rico is 42% less. This is because the reversed Walker circulation during an El Niño imply divergent motion over the east/central equatorial Pacific, inducing westerly flow over the tropical Atlantic. |
Fig 1. Location of tropical cyclones and tropical storms around North America on individual days between 1949 and 1992, (a) during 10 El Niño (warm) years and (b) during 10 La Niña (cold) years. (Source: J.M. Wallace, University of Washington) |

Only about 1.3 hurricanes made landfall on the Atlantic coast of the USA during 1949-1993 in El Niño years (4), instead of the usual 1.8 or so. Data from 1900 to 1997 suggest that the chance of two or more hurricanes landfalling anywhere in the continental USA is 28% during an El Niño year, compared with 48 % at other times and 66% during a La Niña (5).
The SOI-hurricane correlation is essentially simultaneous, so one needs to first predict the Southern Oscillation Index (SOI) to predict hurricane frequency. El Niño events usually start late in the year and end in the middle of the next year, although there are many variations. For instance, the strong El Niño of 1997-98 started unusually early (in July), and it also collapsed early, around March 1998. By July 1998 La Niña conditions prevailed. There were only 7 Atlantic named tropical strorms in 1997, but 14 in 1998. So in this case, the inactive hurricane season preceeded the ENSO peak.
There are other, at least partly independent factors affecting the frequency of tropical cyclogenesis in the Atlantic, such as the quasi-biennial oscillation and Saharan easterly wave activity (Section 13.5).
Australia
A statistically significant correlation exists between the October SOI and tropical cyclone frequency around Australia during the season which starts in November (Fig 2), so the measured SOI has a predictive value. However correlation coefficient for the data shown in Fig 2 is only 0.47. A slightly improved correlation would result if one removed the apparent trend in TC frequency between 1950-70; in all likelihood, this trend is artificial as it coincides with the advent of better monitoring systems, in particular weather satellites (6).
The correlation is explained as follows: during an El Niño (SOI negative) tropical cyclogenesis often occurs further east, in the central Pacific (Fig 13.15), and many of these cyclones recurve southward before reaching Australia's longitude. Not surprisingly, a stronger correlation exists between the SOI and landfalling TCs in Queensland (3).
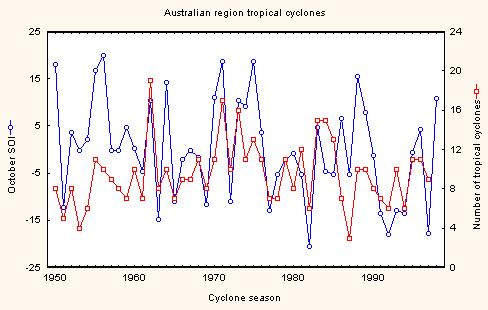
Fig 2. A comparison of the number of tropical cyclones around Australia (between 105-165° E and the equator) during the November-May season, and the Southern Oscillation Index during the previous October (source: N. Nicholls, Bureau of Meteorology Research Centre).
But even around the northwest of Australia, more cyclones occur (and more make landfall) in years when there is a highly positive SOI (i.e. La Niña) in the months prior to the cyclone season (7). Also a high SOI is associated with an increased likelihood of TCs early in the season (Nov/Dec), whereas late TCs (in April/May) tend to happen when the October SOI was strongly negative (in which case La Niña conditions are often in place by May). The reduced number of TCs in El Niño years includes a higher percentage of intense cyclones (category 2 or higher). So the number of severe TCs affecting West Australia is about the same whatever the SOI. There are other factors affecting Indian Ocean TC frequency.
Elsewhere in the Pacific
Following El Niño events, hurricanes form slightly more often in the Pacific south of Mexico, due to the higher SST there, and they tend to drift further westward towards Hawai'i. In the northwest Pacific, typhoons tend to be more common (a 52 % increase at Guam) in El Niño years (8). The average location of tropical cyclogenesis is further east, and slightly further south, and the average typhoon track is longer.
References