An update on ENSO
|
E. Linacre and B. Geerts |
4/'02 |
![]()
A simple and accessible review of what is
known currently about the El Niño Southern
Oscillation phenomenon (Section 12.7) has
been published by Trenberth (1). Notable is the practicability now of
predicting the progress of the ENSO event for up to a year or so, once it has
started, by allowing for changes in the equatorial Pacific Ocean, in addition
to the atmosphere. He made a useful point, that such predictions of climate
(the statistical character of the atmosphere) are unaffected by the
shorter-term random impact of chaotic behaviour, which limits the scope of weather
prediction. On the other hand, the smaller the region being considered, the
greater the impact of such natural variability, masking the effect of ENSO on
the climate.
There are various indices other than the SOI, which is based on the sea level pressures at Darwin and Tahiti. One uses at zonal wind departures in the equatorial Pacific. A third index quantifies departures from normal outgoing longwave radiation into space. More convection in the central/eastern equatorial Pacific implies cold cloud tops there, which emit much less IR into space. Other indices are ocean-based: SST anomalies, depth of the thermocline, etc.
Oceanic surface warming in some places
creates tropospheric convection and then upper divergence. This triggers Rossby
waves, which are tropically trapped but nevertheless have some effect on the
subtropical highs, so that their effects are felt worldwide. The position of
the effects depends on the pattern of global circulation at the time of year,
as well as the natural variability of weather at each place and the
distribution of land and sea. Feedback also complicates matters, since changed
winds alter sea-surface temperatures. The latter govern the locations of
convection, and hence indirectly alter the wind pattern.

Fig 1. ENSO index based on a number of parameters, including sea surface temperature, outgoing longwave radiation, and sea level pressure. El Niño events were clearly identifiable in 1951, 1953, 1957-8, 1963, 1965, 1969, 1972-3, 1976-7, 1982-3, 1986-7, 1990-5, and 1997-8 (black and white version)
Modern study of ENSO events began with the examination of what happened during the 1972 event, one of the stronger events in history. The '90-'95 El Niño was the longest-lasting in the past 120 years (Fig 1). The most intense was the 1982-3 ENSO event, but it was rivaled by the 1997-8 El Niño, which followed an intense but brief La Niña.
The 1997-98 ENSO event
The first ENSO event properly forecast and observed from start to finish was the ‘strong’ one between May 1997 and June '98 (2). A correct forecast of its impacts was issued almost six months beforehand, providing advance warning to those likely to be affected. The main impact in the midlatitudes, especially in north-America, was an increase in the number and intensity of storms around 35 N, hence an increased chance of extreme weather.
The 1997-98 ENSO event differed greatly from previous El Niños, though they too exhibited a wide range of behaviours (3). The Southern Oscillation Index was low, but not as low as during the record 1982/3 ENSO. What appeared singular about the 1997 situation were the rapid development of the event, the early onset (upwelling off Peru became suppressed in May/June rather than around Christmas), and the large sea surface temperature anomalies as much as 5 K in the central equatorial Pacific.
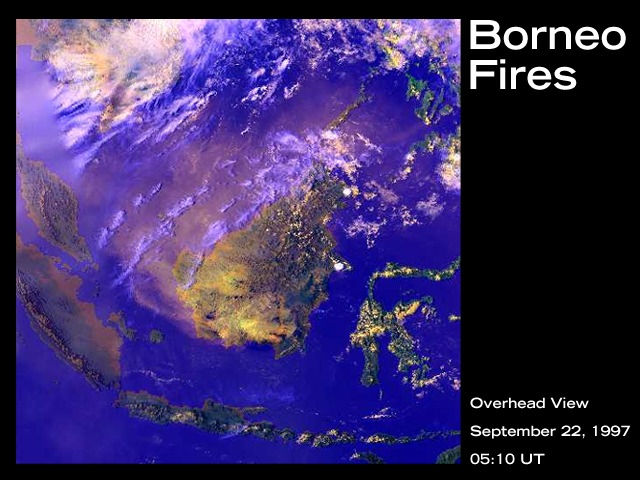
Apart from the high temperature of the sea surface in the central and eastern equatorial Pacific, there is another reason for the unusually dry conditions in Indonesia in 1997-98. The Trade winds over the tropical Pacific were weak from June '97 till June '98, longer than in other El Niño events (4). The prolonged drought and subsistence farming practices lead to large forest fires mainly in Sumatra and Borneo. This caused poor visibility in the region, e.g. in Kuala Lumpur. Most regions in Australia appear to be spared of drought. Real-time rainfall anomaly maps of Australia are available from the Australian Bureau of Meteorology. Observed global rainfall anomalies are shown in Fig 2.
Fig 2. Observed precipitation anomalies for the 6 month period Nov '97 - Apr '98. Unlike during the previous very intense El Niño in 1982-83, this event did not bring widespread drought to Australia. In fact, the north Australian monsoon was more active than normal.
References
- Trenberth, K.E. 1997. Short-term climate variations. Bull. Amer. Meteor. Soc., 78, 1081-96.
- Busalacchi, A, et al. 1998. Report of papers to a meeting of the American Geophysical Union in San Francisco in December, in Bull. Amer. Meteor. Soc., 80, 111-2.
- From a lecture by Janette Lindesay in Canberra 22/10/97
- From a statement from the Australian Bureau of Meteorology's National Climate Centre, Melbourne on 6/11/97.