Global rain gauge data
|
B. Geerts and E. Linacre |
3/’02 |
![]()
|
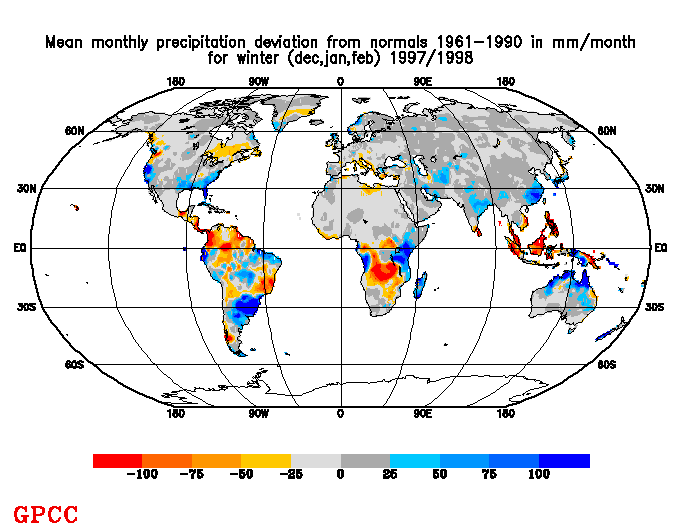
Of the order of 200,000 routinely operating recording precipitation gauges have been installed around the world during the last 4 decades (1). The density of gauges is quite variable, and it relates quite well to the population density (Fig 1). Global rain gauge data are quality-controlled and archived by the Global Precipitation Climatology Centre in Germany. At their web site monthly and annual precipitation totals can be plotted for any continent and for any time after 1994. For instance, the rainfall anomalies for December '97-February '98 (Fig 2) clearly show the effect of the strong El Niño present at that time: it was wetter than normal in coastal Peru and the southern half of the USA, and dry in Indonesia. Surprisingly, perhaps, the north Australian monsoon was more active than normal. Long-term data sets of data from 8,300 stations are available from the National Climate Data Center in the USA. This data set allows evaluation of the global average, as well as interannual variability and longterm trends. Recent estimates range from 784 - 1130 mm/a. One of the problems is that gauges in mountainous country are not installed randomly but in valleys, biasing the measurements. In remote areas and offshore, precipitation amounts are estimated by means of satellite data. The combination of rain gauge and remote data yields the best global precipitation estimate. |
Fig 1 Number of range gauges per grid box. These boxes are 2x2 degrees. (Source: Global Precipitation Climatology Project) |
Changes in the records from selected gauges can be detected more reliably. With respect to the respective 1951-1980 average, there was an increase of about 10% at high latitudes in the northern hemisphere, between 1940-1990, and 5% over the whole of the southern hemisphere during 1930-1990. In the southern hemisphere there was a temporary increase of about 10% around 1975. However, there was an 18% decrease over the northern tropics in 1945-1990, and a global decrease of 60 mm/a during 1955- 1995. These figures may be compared with the general increase one would expect from global warming of the oceans.

Fig 2. Global precipitation anomalies (in mm/month) for Dec-Feb '97-'98.
Reference
(1) Hulme, M. 1995. Estimating global changes in precipitation. Weather 50, 34-42.
