|
E. Linacre and B. Geerts |
7/'98 |
![]()
There are alternative ways of presenting information on the frequency of rainfalls of various intensities.
Return period
Fig 1 indicates the average time (in years) between weekly rainfalls of various amounts at Gleniffer in South Africa. The time period of accumulated rainfall (here one week) is arbitrary and depends on the application: shorter time periods are considered for flood control in smaller watersheds. Thus, at Gleniffer, 80 mm/week is exceeded once in two years, on average, this being the relevant ‘return period’. Likewise, a drainage system will usually overflow once in three years if it is designed to cope with a rainfall of up to100 mm in a week. It can be seen that the data points in Fig 1 align more or less when the rainfall amounts are plotted on a logarithmic scale. A line through the data allows extrapolation over periods longer than the observation period.
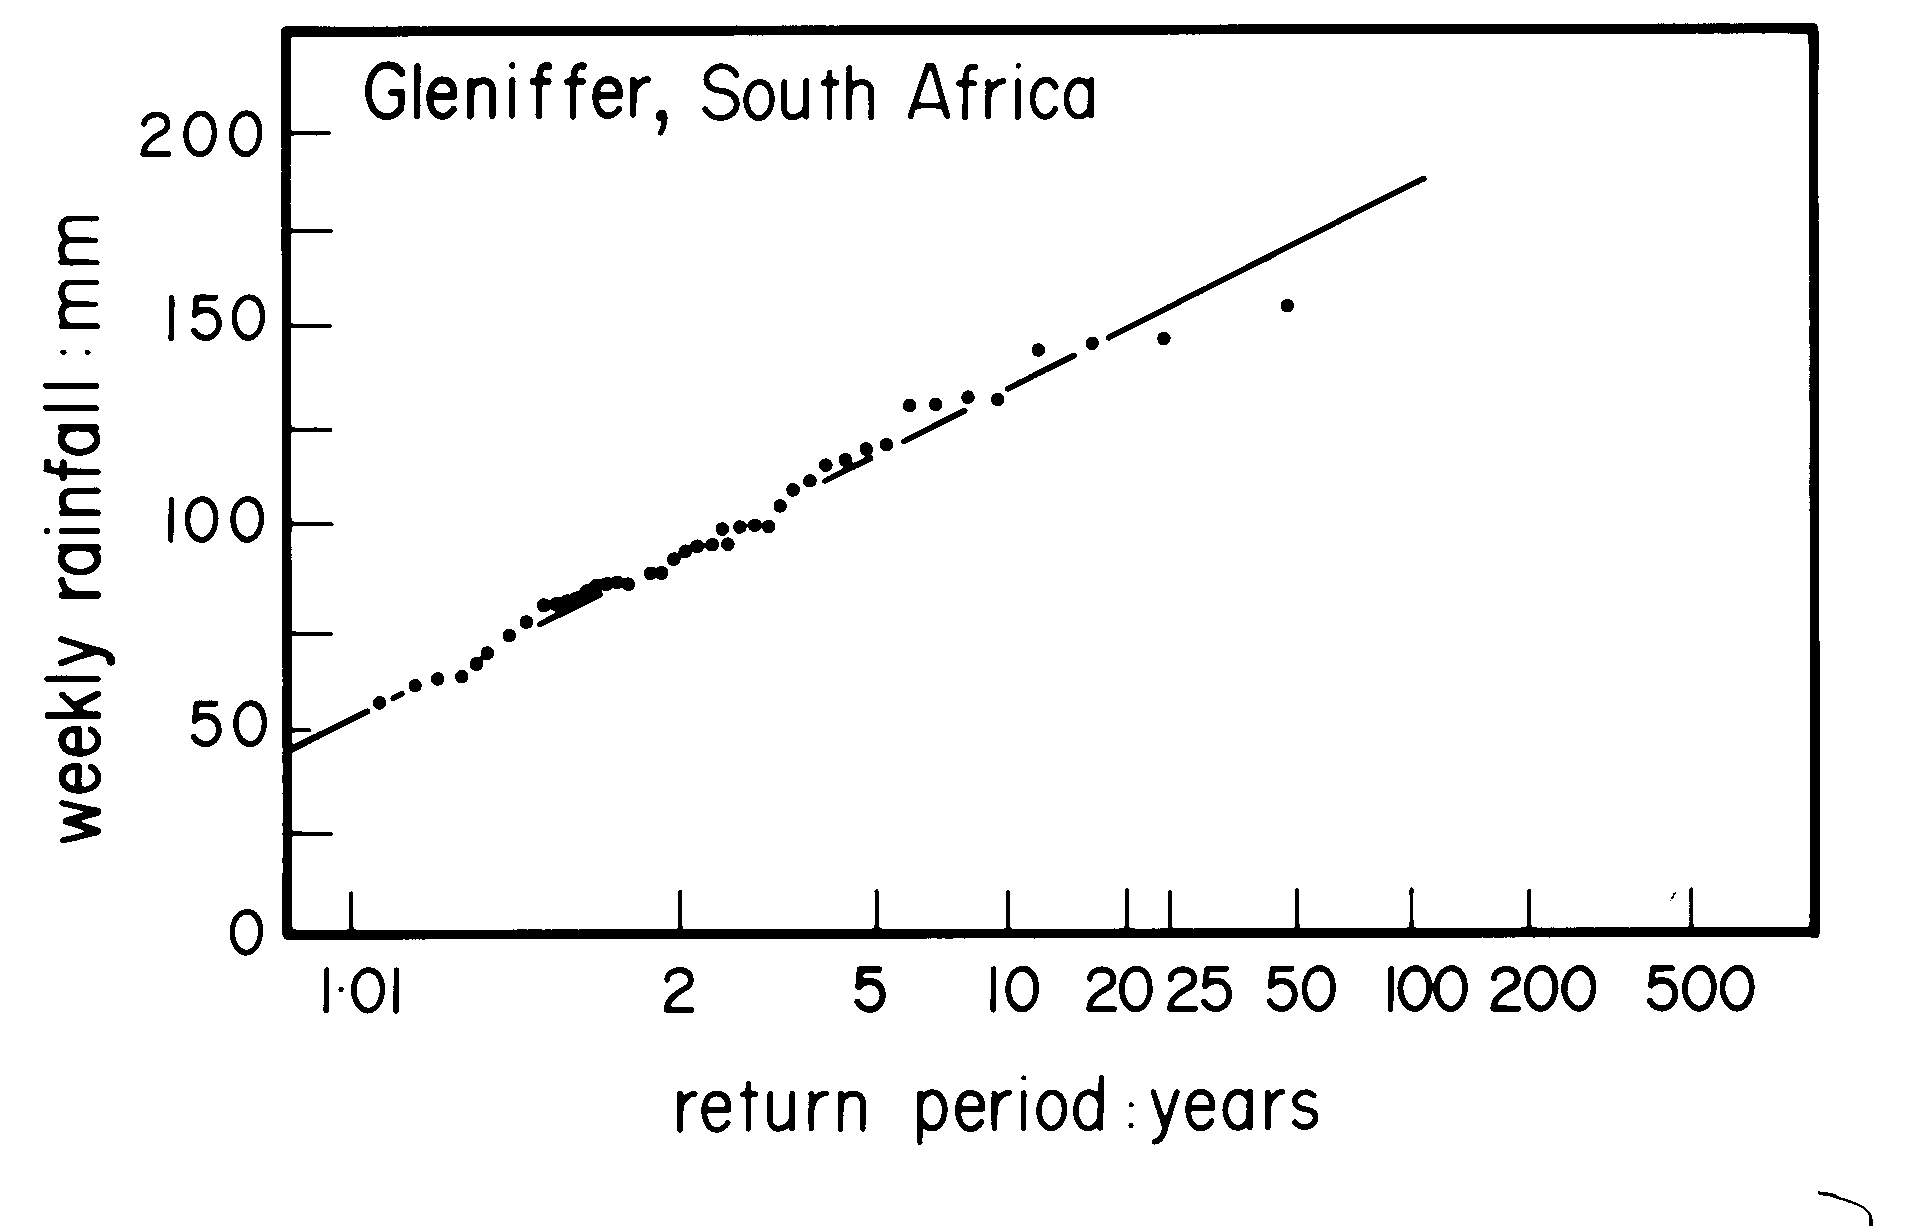
Fig 1. Return period of various rainfall amounts at Gleniffer (South Africa)
Probability
The probability of a particular rainfall amount is shown in Fig 2. The horizontal axis shows this probability in such a way that if a normal distribution follows a straight line. Probability units are the inverse of return periods, e.g. a probability of 33% is the same as a return period of three years. The slope in Fig 2 is opposite to the one in Fig 1 simply because Fig 2 shows the opposite, i.e. the chance that rainfall does NOT exceed a certain amount. The vertical unit in this case is annual rainfall.
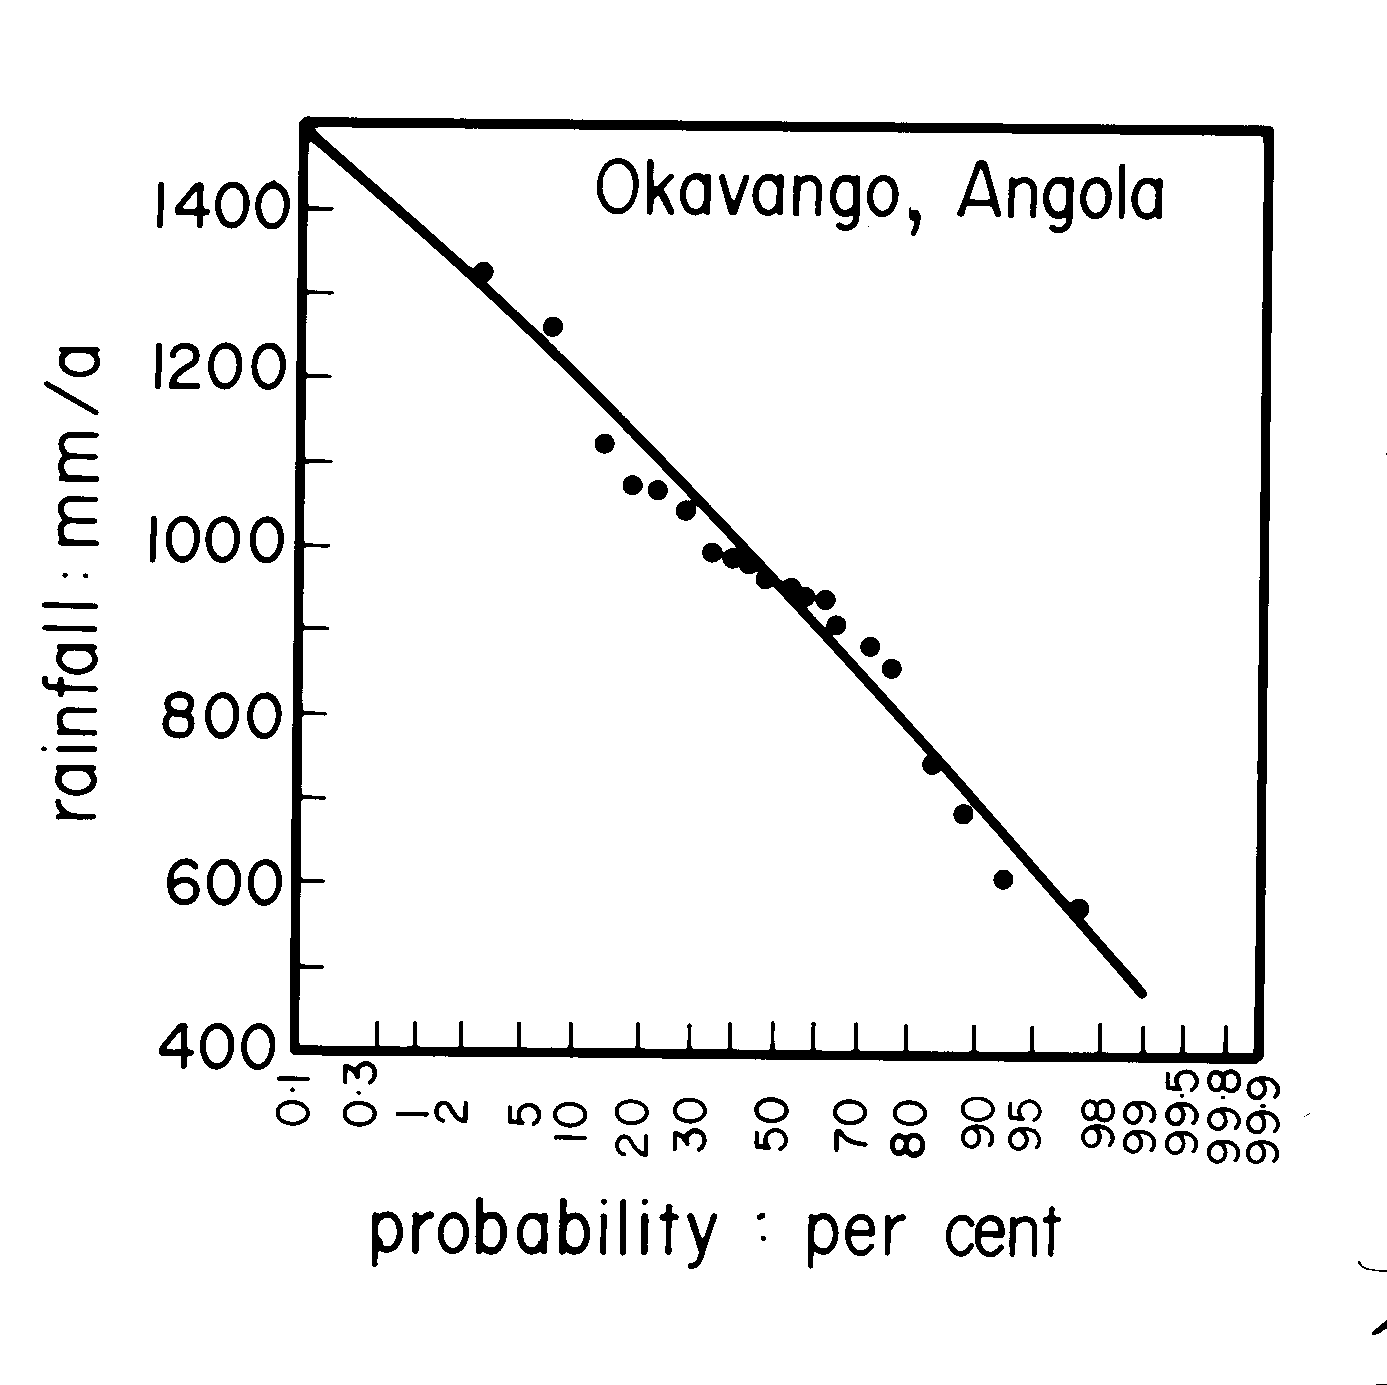
Fig 2 The probability that the annual rainfall within any particular year at Okavango (Angola) is less than a certain value.