|
E. Linacre and B. Geerts |
2/'98 |
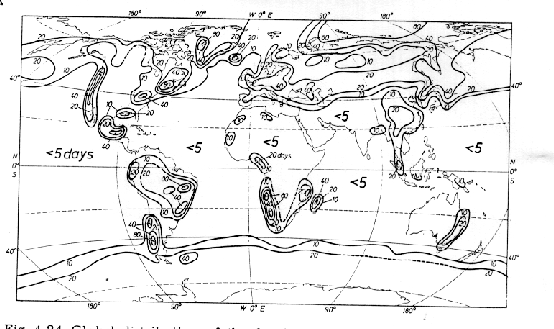
Fig 8.7 in the textbook should be replaced by Fig 1 below. There are some differences between the two Figures.
Fig 8.7 shows over 125 days with fog on the northern Andes (presumably coastal Peru), whereas the map below shows a maximum in South America of 80 days annually over southern Chile. Likewise, the Australian east coast is shown in Fig 8.7 as experiencing over 75 days with fog, while Fig 1 here gives only about 20 days each year.
Fig 1. Number of days of fog per year (from Baumgartner 1982 (1), based on Bluthgen & Weischet 1980 (3))
Fig 8.7 was based on diagrams given by Hess (4). The former derived it from a to us inaccessible American report by N.B. Guttman in 1971. The Baumgartner paper (1) was derived from the work of Bluthgen, who published in German. Bluthgen's 1964 edition textbook (5) contains a relatively crude map, consisting of isopleths linking places having over 40 or 80 days of fog annually, and showing the limit of high-latitude fogs which occur mainly in summer. The monumental 1980 version by Bluthgen & Weischet (3) shows Fig 1, which was essentially the same as the Figure in the 1964 edition, with over 80 days of fog each year on the southern Chile coast and little fog in the northern Andes.
Some comments:
1) Fog is highly localized especially along the coast and in mountainous terrain, and therefore isopleths on a world map cannot be precise. For instance, there are about 12 fogs annually in the city of Sydney (on Australia’s east coast), but about 60 each year at Richmond, in a shallow inland valley only 50 km from Sydney.
2) Both Figures (Fig 1 and Fig 8.7) are based on daily station observations only. Fog can be estimated remotely, from space. Fog is likely to be present when the visible satellite image shows a high albedo over an area where the corresponding infrared image does not see any cloud, i.e. the cloud top temperature is about the same as the surrounding Earth surface temperature. This technique does not work at night and where the fog occurs below a cloud deck. More complicated techniques using a combination of other infrared channels can compensate for this. Fog detection algorithms may include the lack of movement (as seen by satellite), the confinement to topographic boundaries (coasts/mountains), and cloud top texture (fog looks smooth). Satellite-based climatologies are more accurate because of a much-improved spatial resolution, especially offshore. Radars are not very useful to detect fog, since the fog droplets are too small.
(1) Baumgartner, A.G. et al. Global climatology. In Plate (2).
(2) Plate, E.J. 1982. Engineering Meteorology (Elsevier) 740pp.
(3) Bluthgen, J. & W. Weischet 1980. Allegemeine Klimageographie (de Gruyter, Berlin) 887pp.
(4) Hess, W.N. (ed.) 1974. Weather & Climate Modification (John Wiley) 842pp.
(5) Bluthgen, J. 1964. Allgemeine Klimageographie (de Gruyter, Berlin) 599pp.