|
B. Geerts and E. Linacre |
1/'99 |
The stratospheric veil of fine dust created by a large volcanic eruption (preferable near the equator) leads to appreciable, but transient cooling around the globe, especially in summertime and at high latitudes, due to an increase of planetary albedo (1)(Note 2.G). However, theory suggests that aerosols bigger than 2.2 microns cause net warming, because the trapping of infrared radiation exceeds the effect of the scattering of sunlight (2). Therefore violent volcanic eruptions, such as the Krakatoa in 1883, would cause some warming for the first few months, and then, when the larger particles have settled out, larger global cooling by 1-2 K.
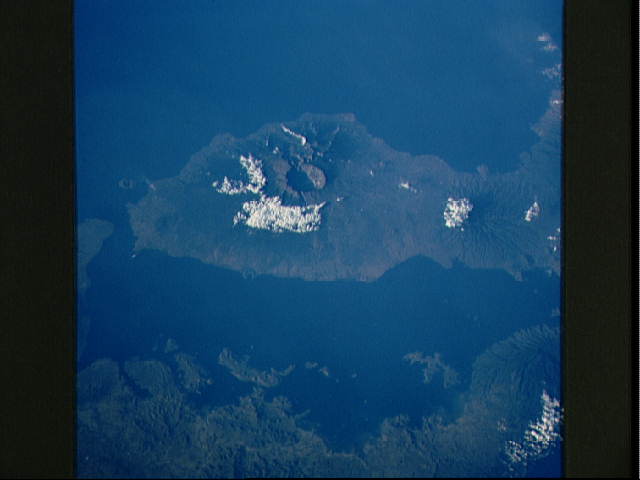
The biggest eruption in the last two decades was the one of the Tambora in 1815, a year which was followed the ‘year without a summer’ in US and elsewhere (3). The Tambora caldera is located on the island of Sumbawa, Indonesia (8.5ºS). The logbooks of 227 ships at sea in 1815-7 (4) show that for about 4 months following the eruption, above-normal temperatures were measured on the Trade routes around Africa to Southeast Asia. Then a La Niña occurred between late 1815 and mid 1816, i.e. sea-surface temperatures were below normal in parts of the tropical Atlantic and eastern Pacific. And by late 1816 El Niño had started. There was a severe drought in Brazil in 1816-17. Marine temperatures outside the tropics were generally lower than normal, apart from anomalous warmth between Greenland and the Azores. These observations fit the pattern yielded by a GCM which incorporates the influx, transport and fallout of stratospheric aerosols from the Tambora, as well as the La Niña (4).
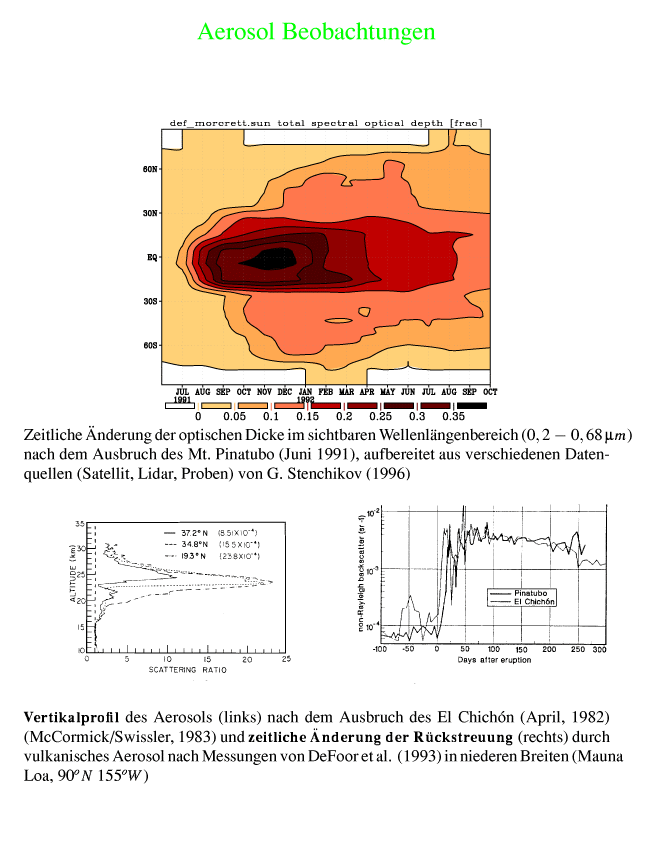
A more recent example is the eruption of Mt Pinatubo in the Philippines in June 1991. There was a slight global warming for the first 3 months after the eruption, possible due to the coincident appearance of an of El Niño event. After the removal the effect of El Niño Southern Oscillation, a fall of global surface temperatures by about 1.0 K in the first year was observed. The anomaly fell to about 0.5 K after 16 months, and erratically returned to normal over the next three years (5). However, the lower stratospheric temperature in the Tropics rose by over 1.5 K within 3 months after the eruption, as a result of the dust’s absorption of solar radiation. Then the temperature there fell back to normal over the following 18 months, as the dust settled out.
Robock and Mao (6) have shown that for 2 years following all great volcanic eruptions since 1850, the surface cools by 0.1-0.2 K in the global mean, and by 0.3 K in the summer in the latitude band 30-60°N. Volcanic eruptions in the tropical belt (30°S-30°N) have the most dramatic impact. In the first winter after major tropical eruptions, North America and Eurasia warm by 1 to 3 K, while northern Africa and southwestern Asia cool by more than 0.5 K.
Support for the accuracy of the numerical simulation of climate and climate change is provided by the close similarity of model-estimated changes of surface temperature to those actually observed after the eruption of Mt Pinatubo. In addition to the trends and mean values, the models used also reproduced satisfactorily the degree of season-to-season variability observed in nature (7).
References
(Tambora caldera image credit: NASA Kennedy Space Flight Center)