In preparation for other work, I needed a better feel for how well droplet spectra were measured in DYCOMS II. One reference I wanted to use was a comparison the LWC evaluated from the probe data versus direct measurements from the PVM and KLWC-5 instruments. The results are briefly summarized here for information and debate. I know that this is a topic of interest to many, so their comments and suggestions will be welcome.
The probes used were SPP100, 260X and PMS-2D. Data were extracted from the 1-sps archives of December 5, 2001 vintage (I don't know whether there were subsequent changes in the particle data in the Jan 2003 version on the mass store).
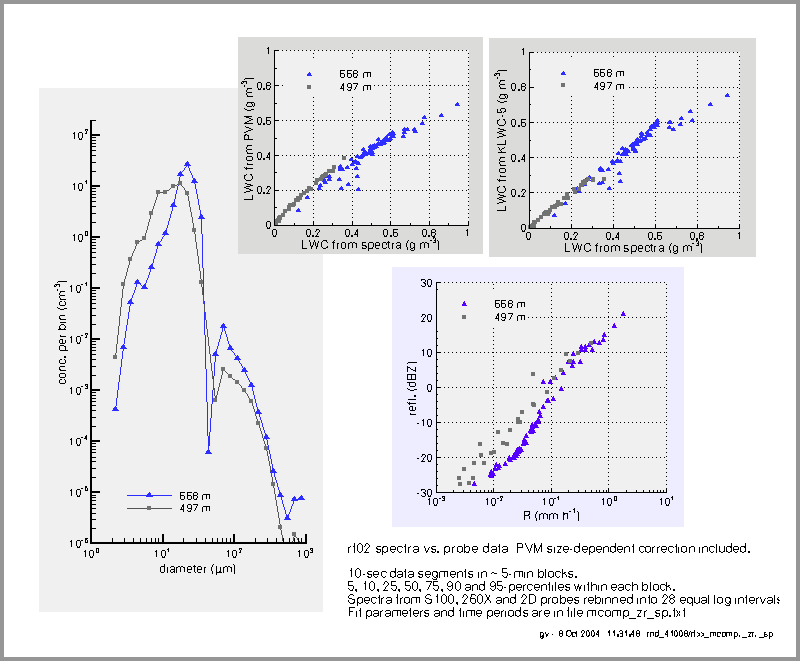
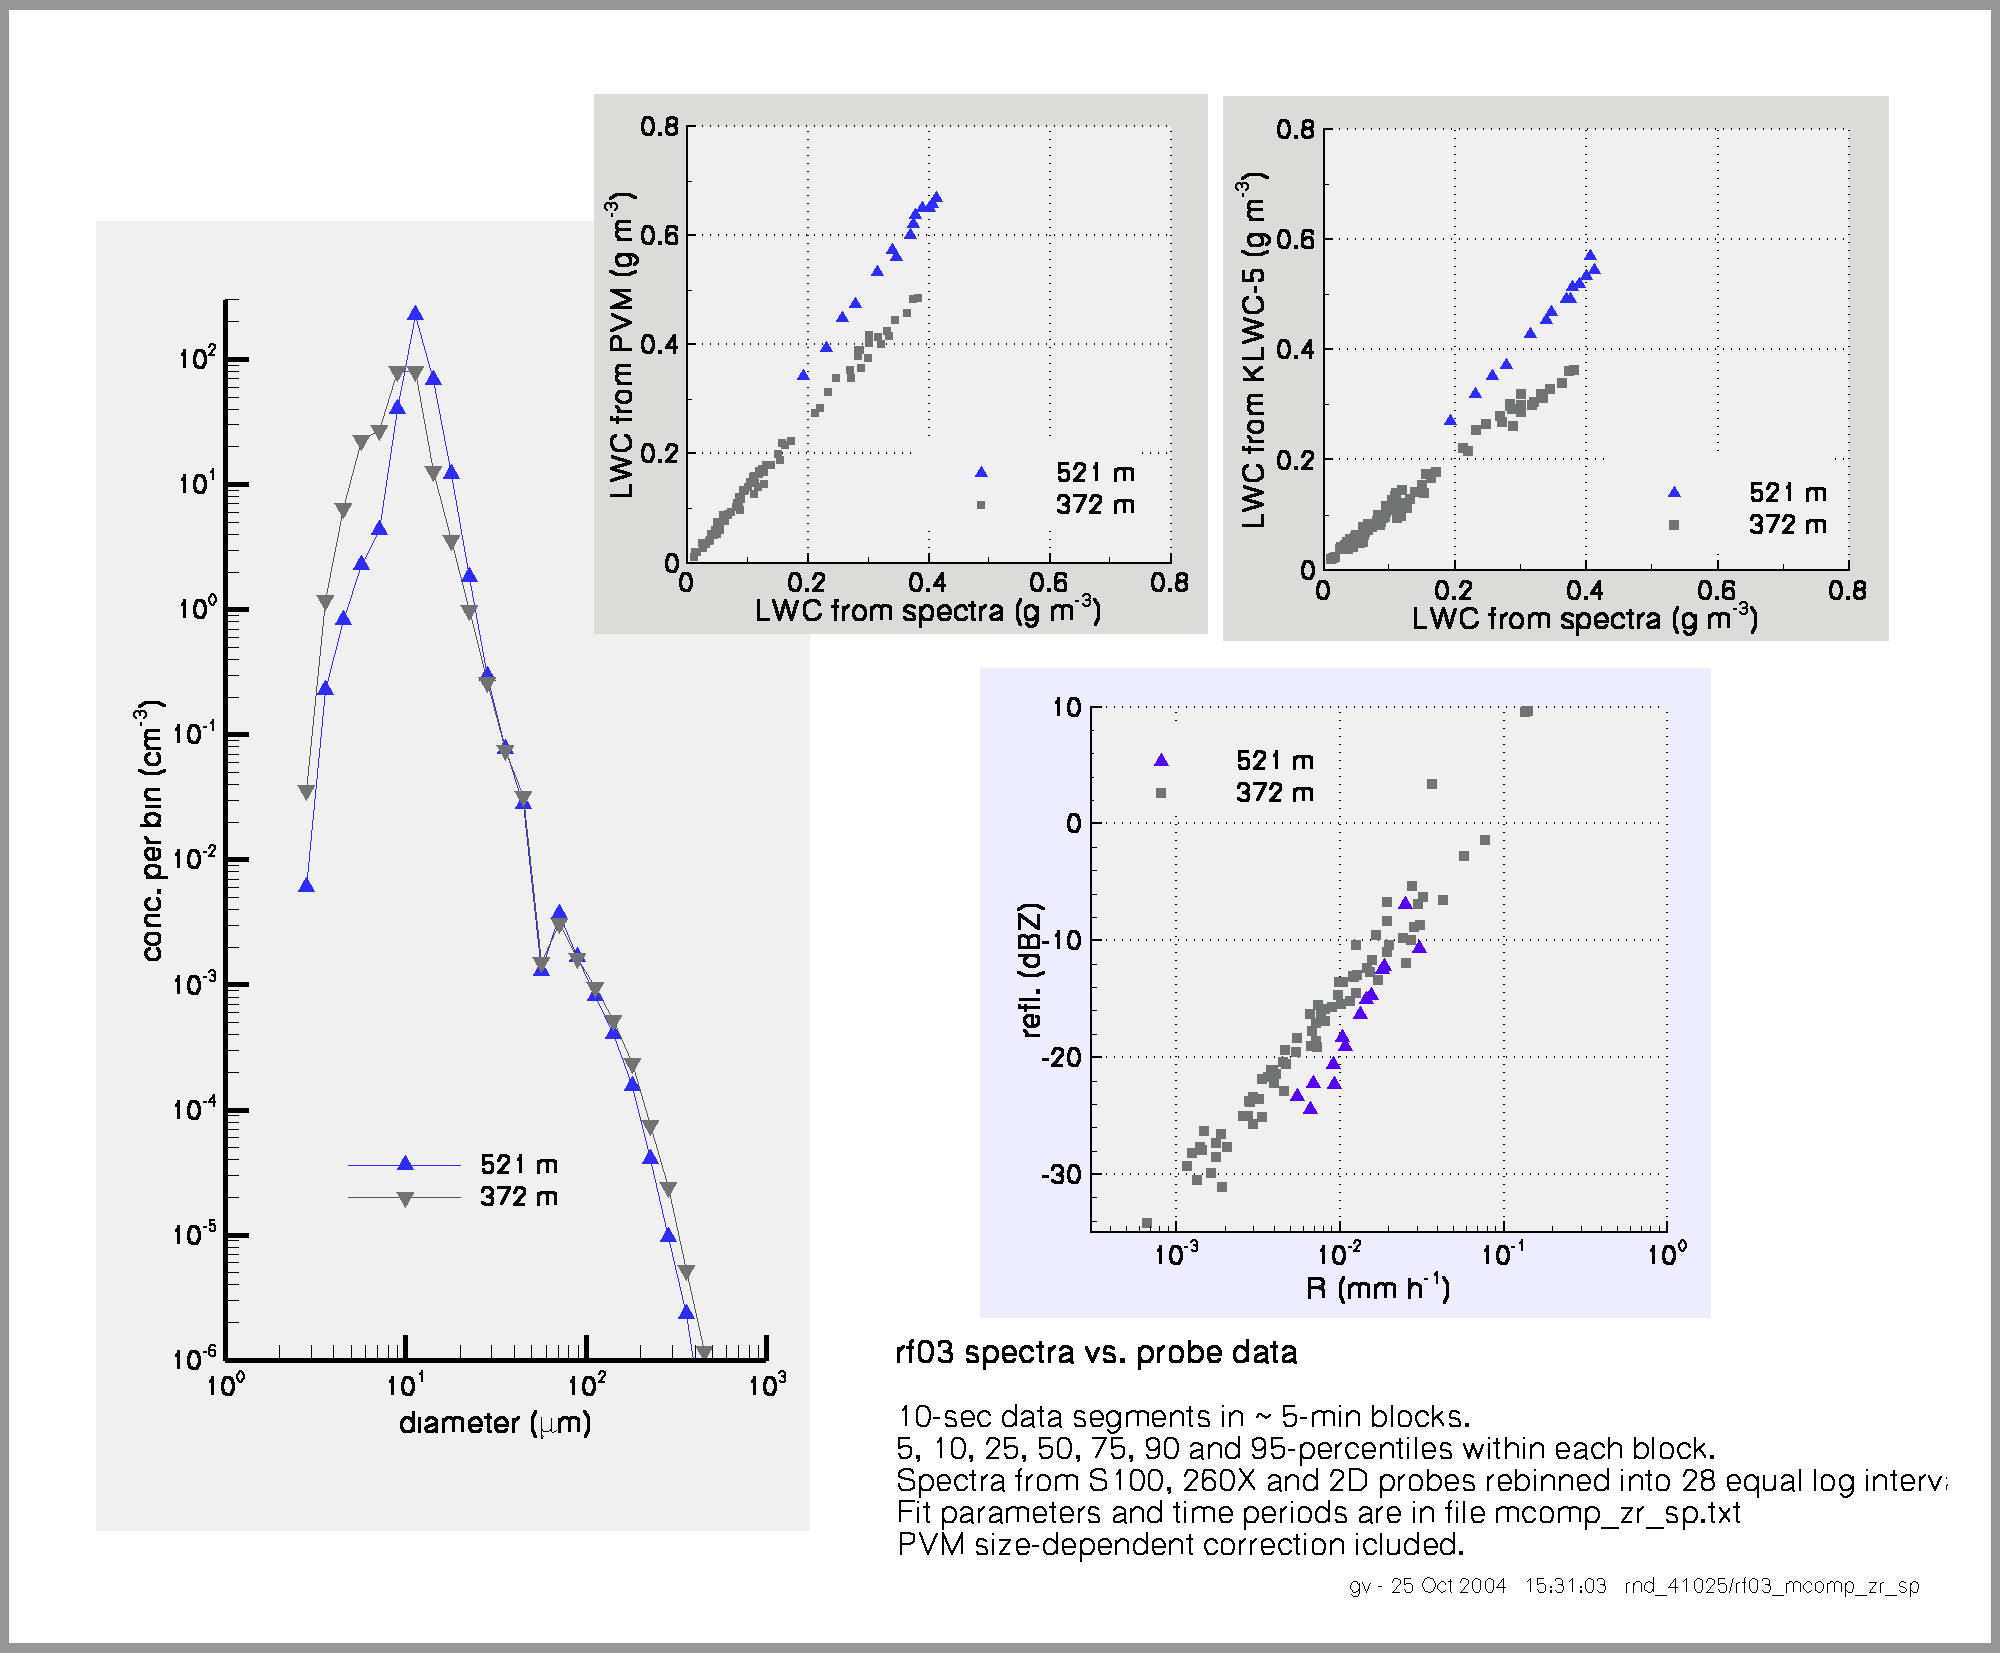
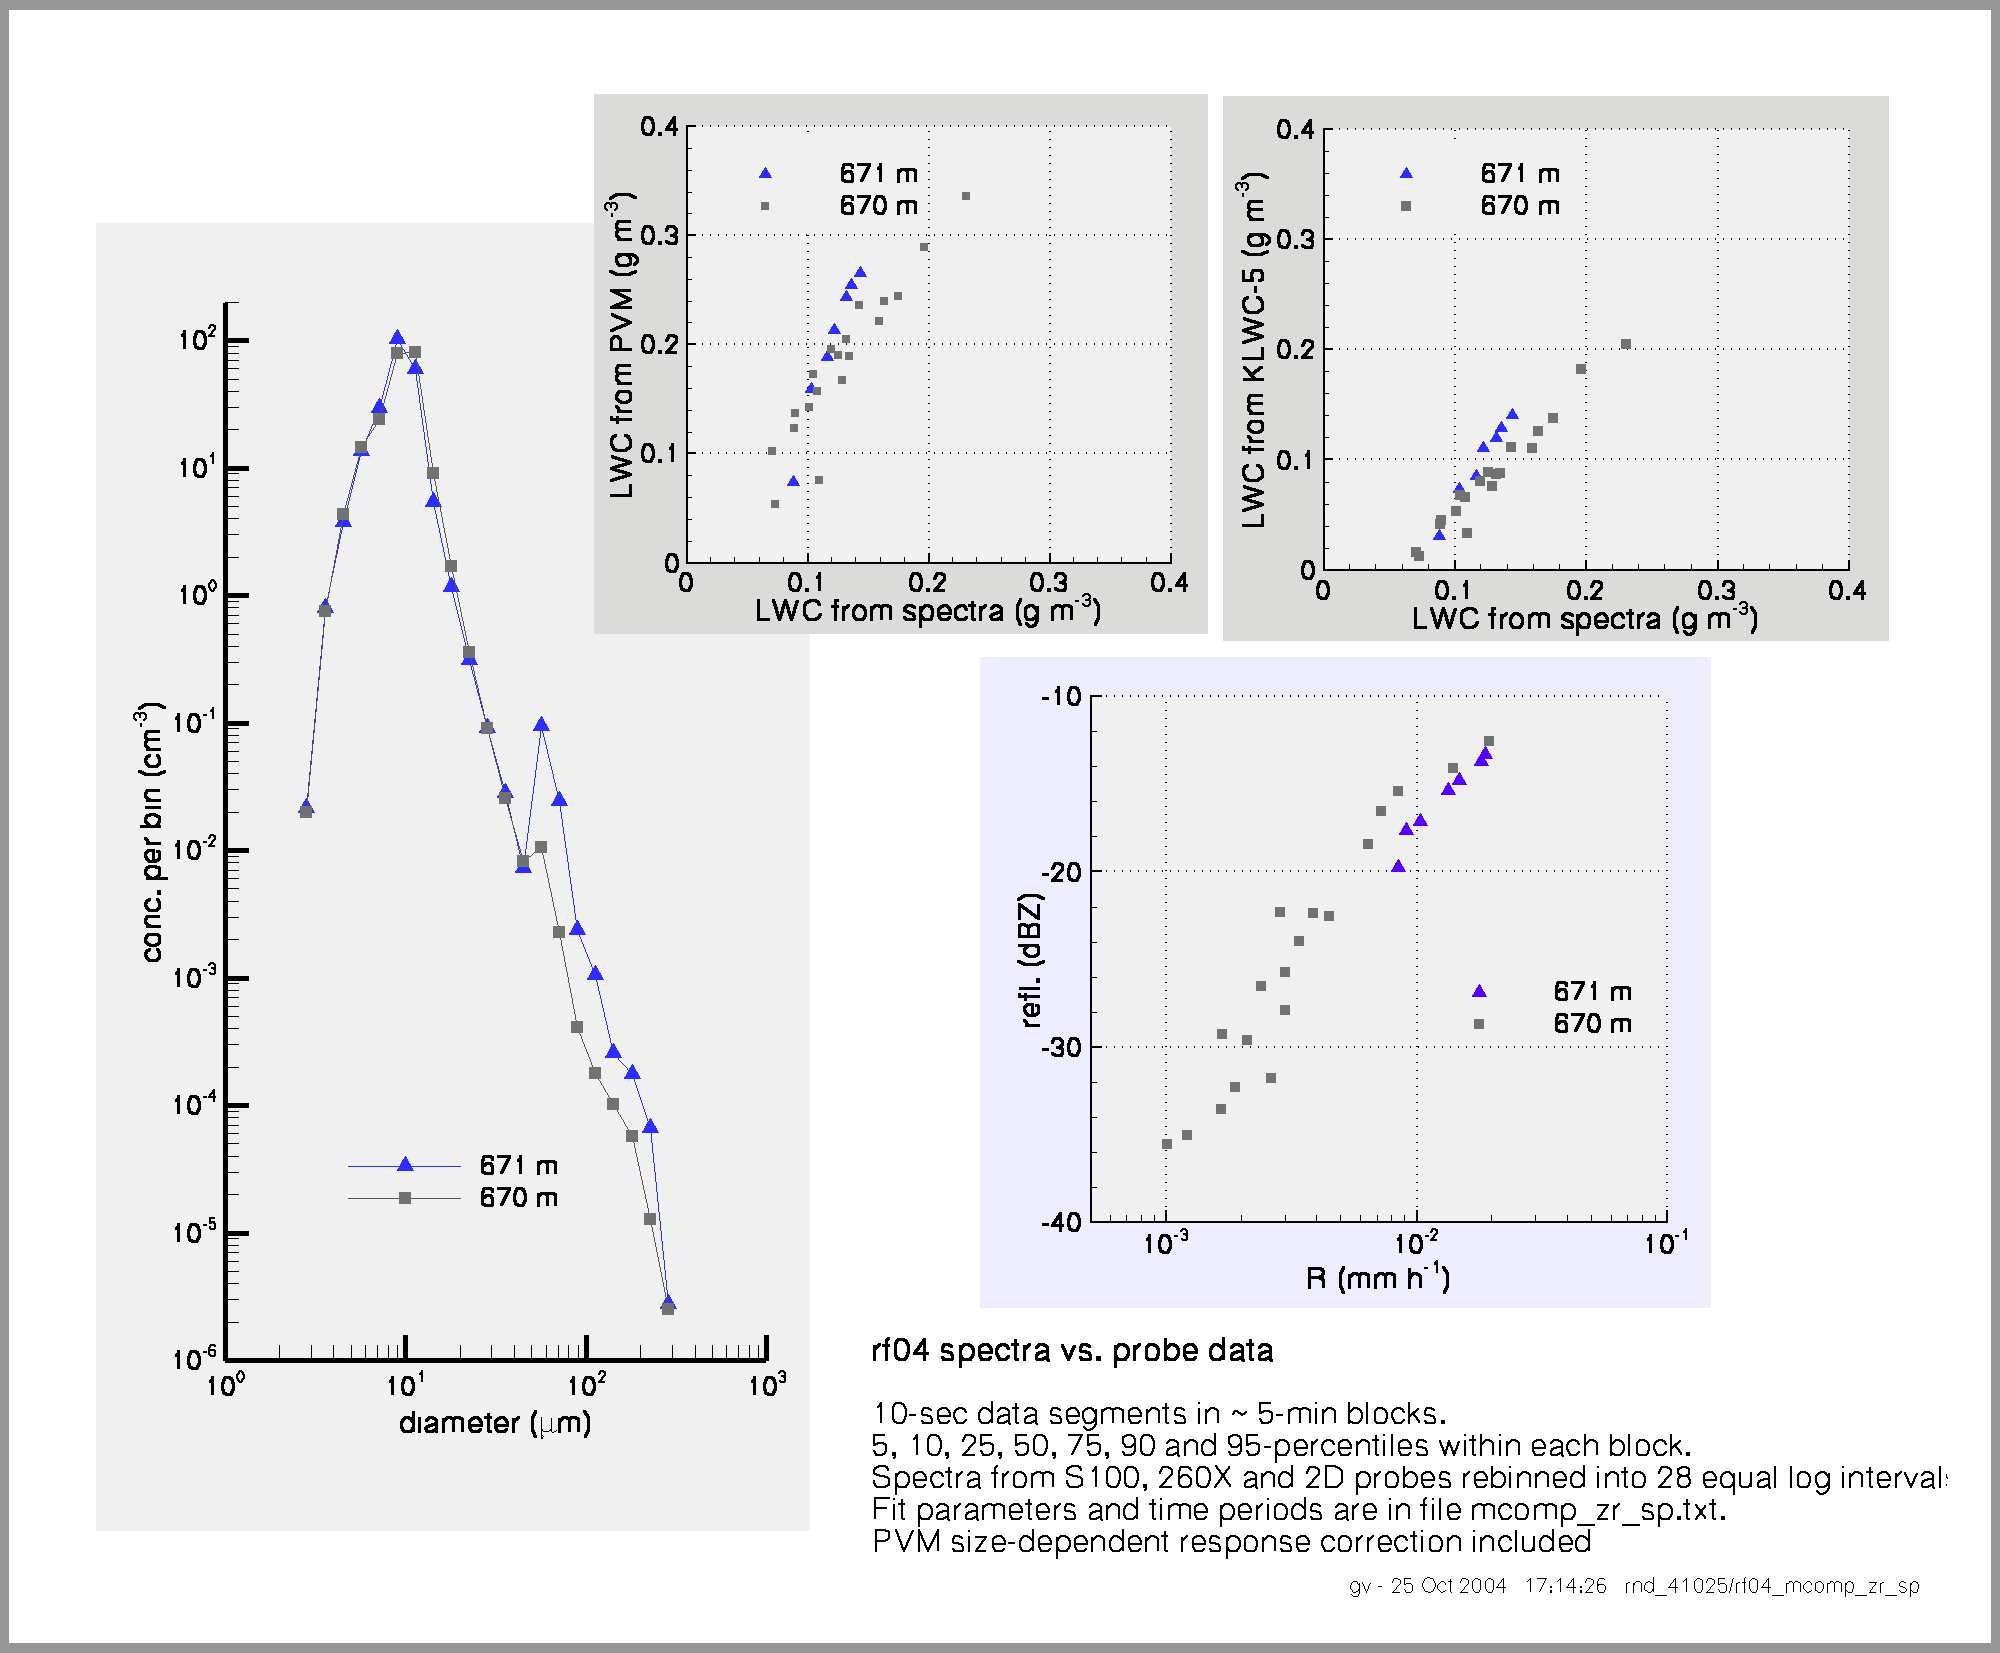
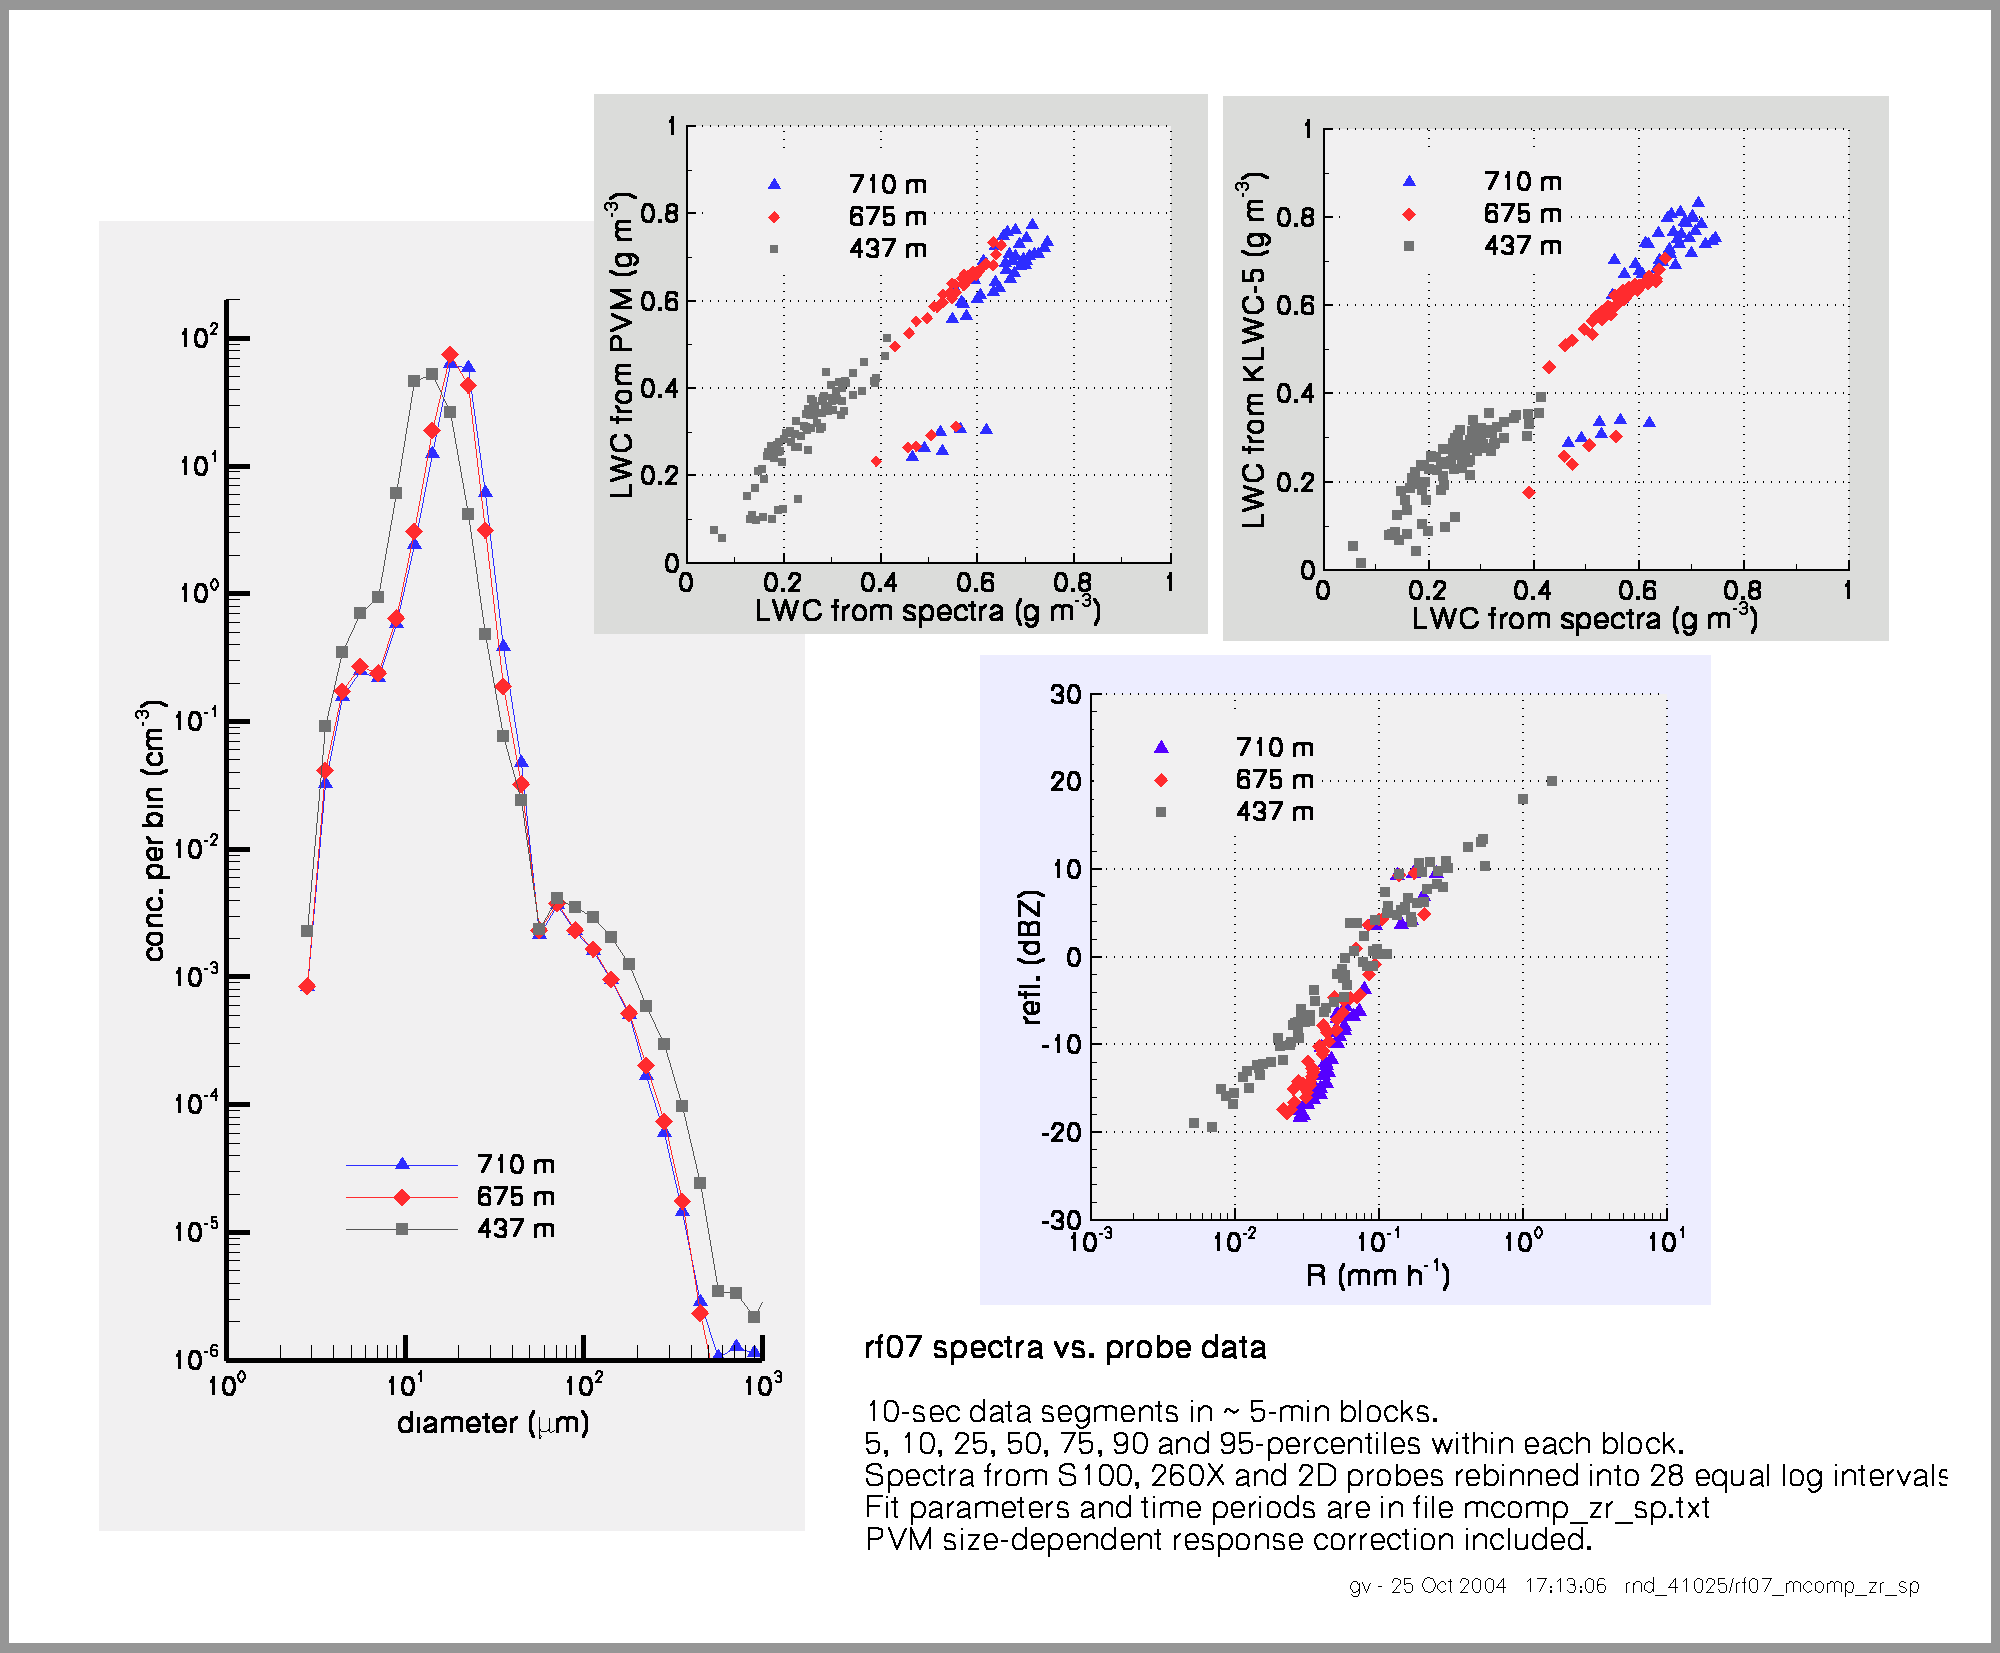
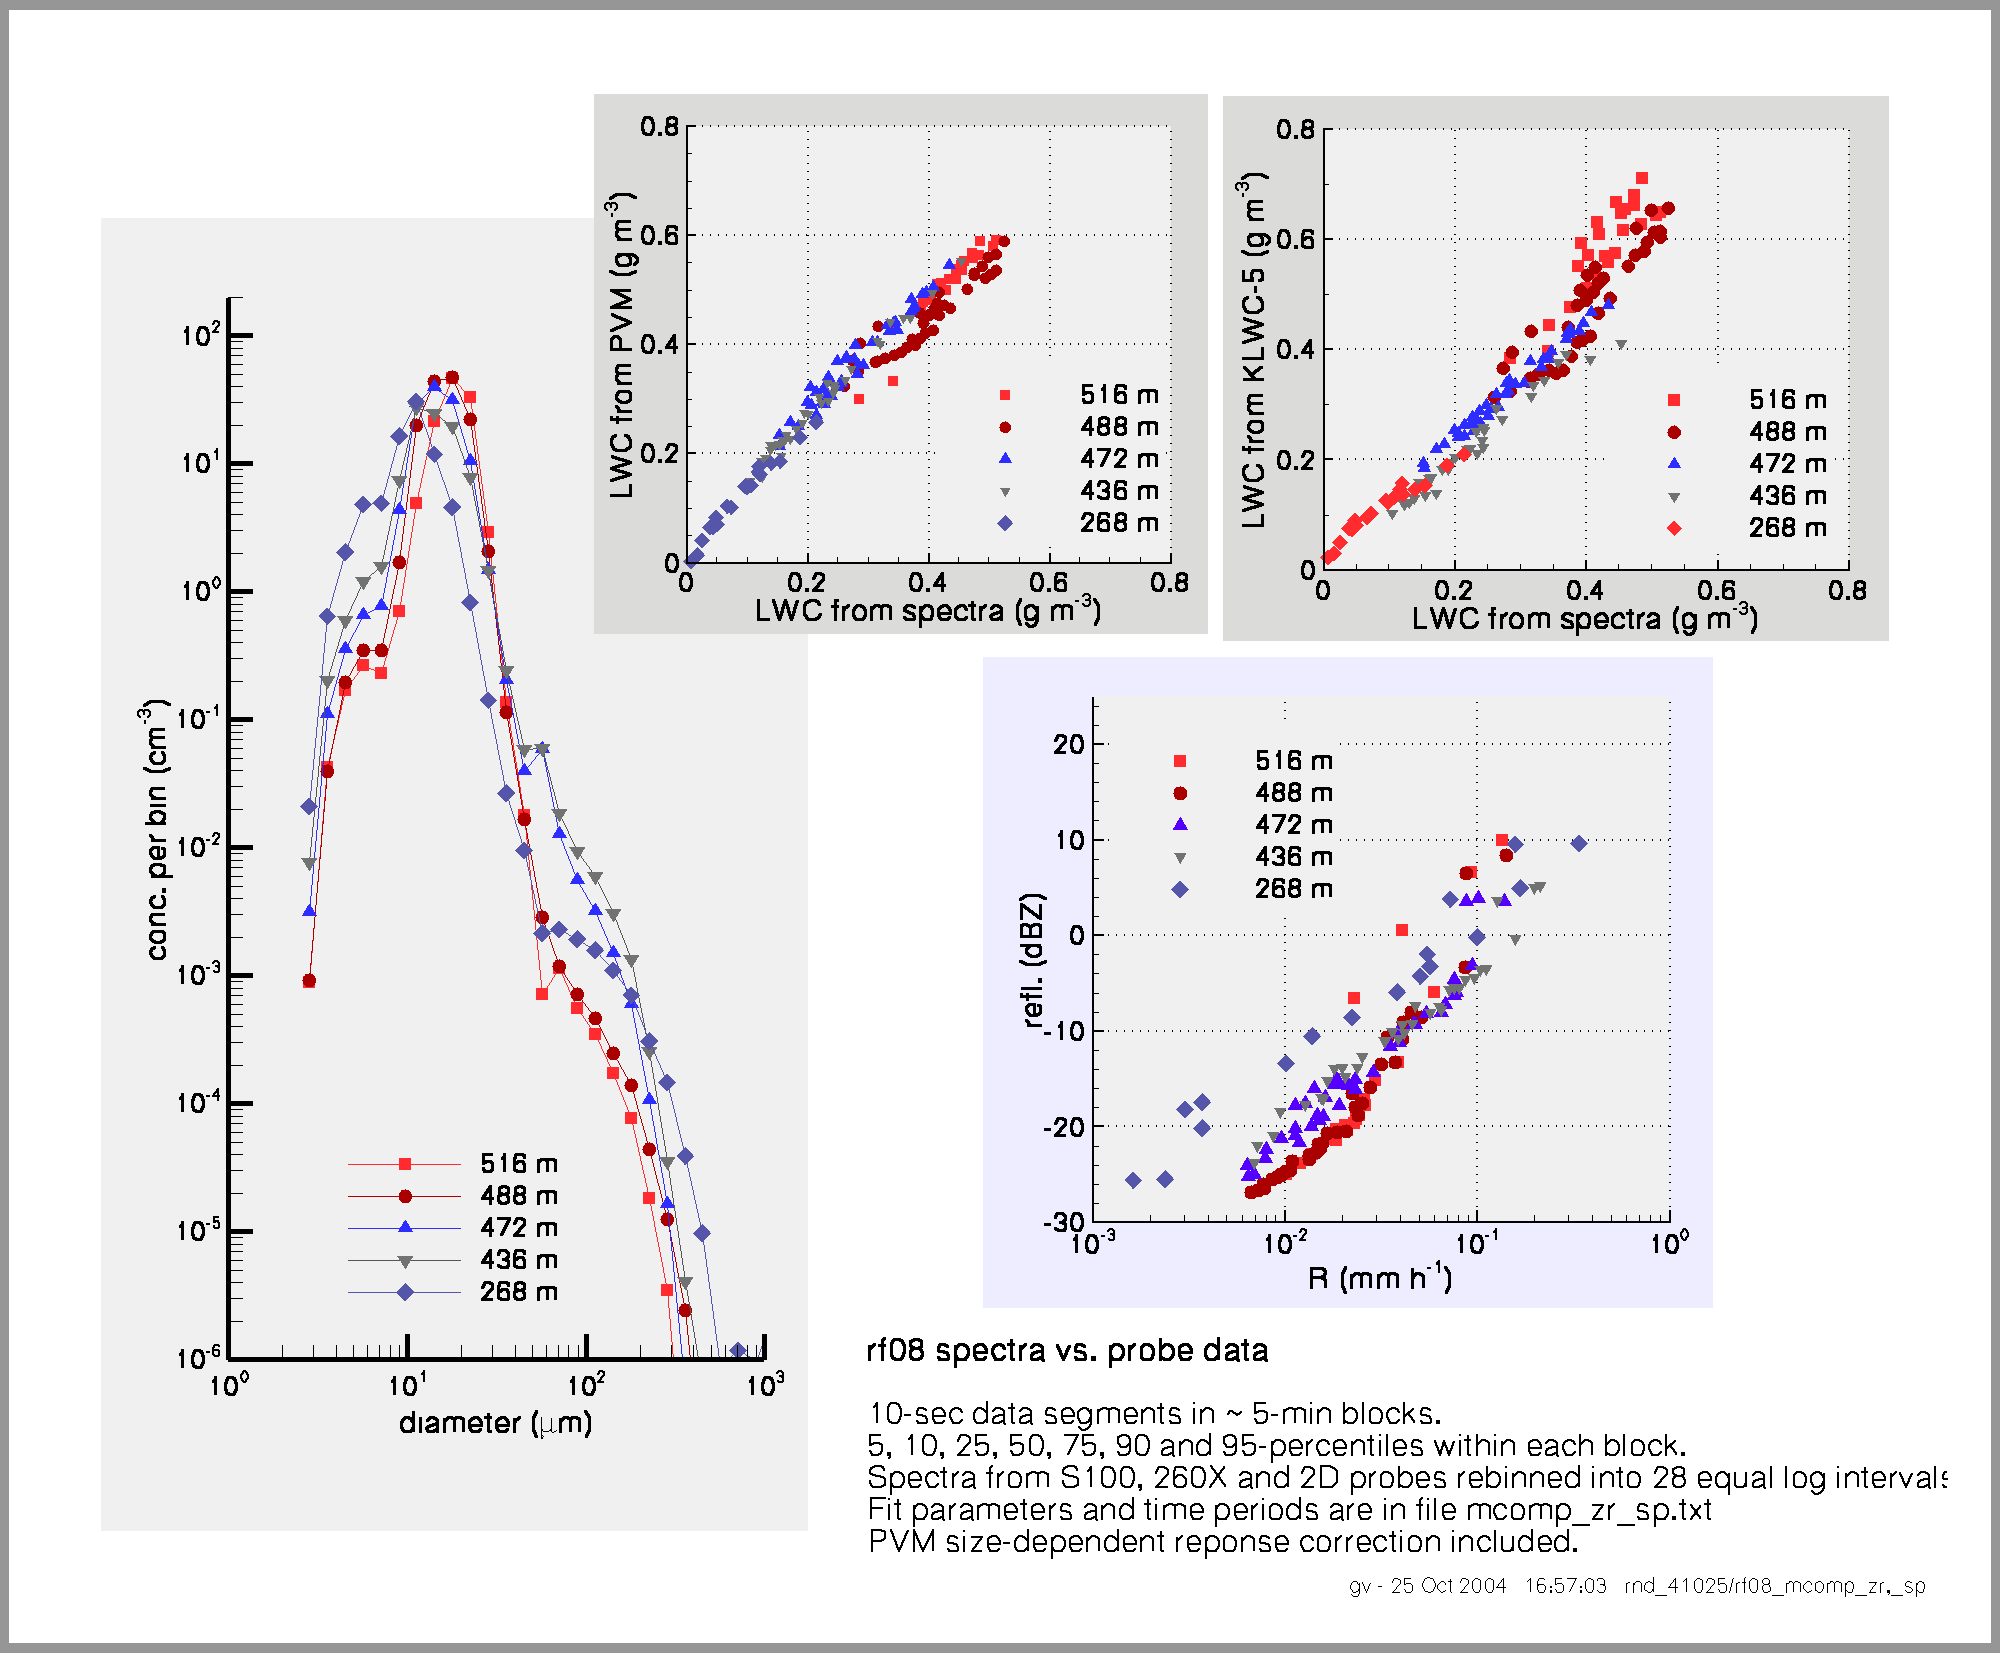
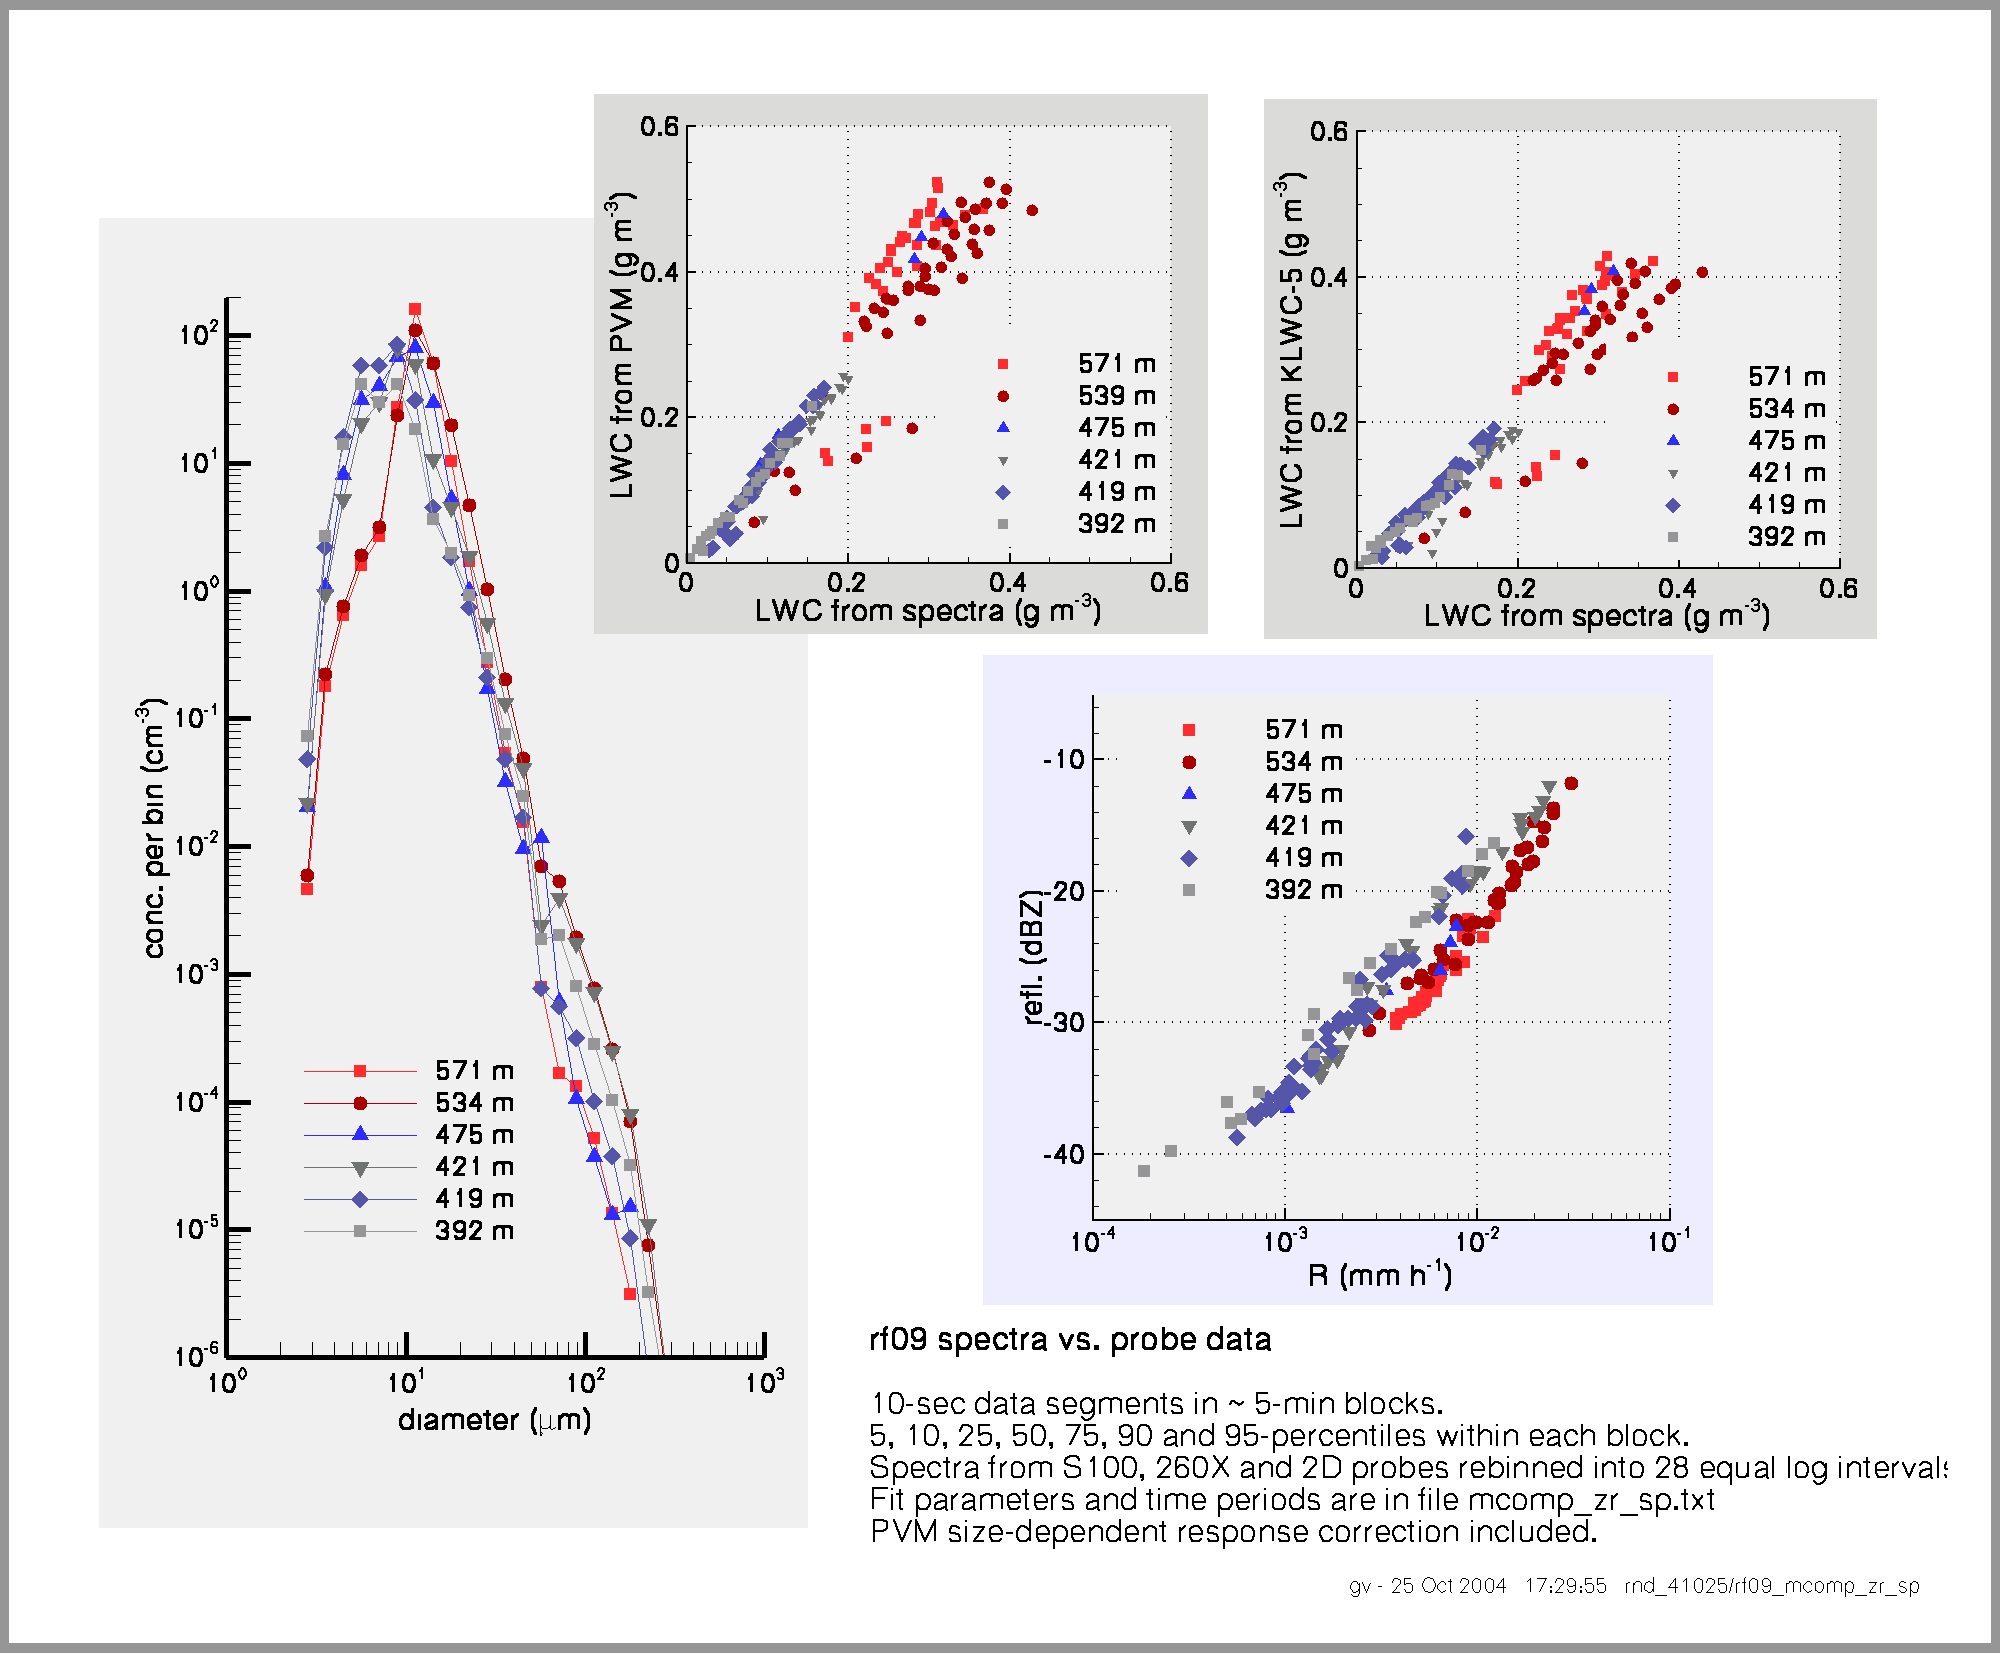
Data processing was based on 5-minute blocks of constant altitude flight. The blocks were selected to be periods without known data problems. All were from within the cloud layer, i.e. where there were droplets detected by SPP100. I screened the particle spectra visually (with nccp) for all blocks, but this is not infallible. Spectra from the probes were rebinned into 28 intervals of D[log(D)] = 0.1, averaging the data from the three probes for each new bin in regions of size overlap. This left the 40-50 mm diameter region the least covered. Within each block, 10-second stepped averages of integrated liquid water content, rain rate and reflectivity were calculated from the spectra and the 5, 10, 25, 50, 75, 90 and 95-percentiles of these values were extracted. Similar percentile values were retrieved for the PVM and KLWC-5 probes. The percentile values are, clearly, not of equal statistical significance, but that distinction is not taken into account in the results shown here.
The blocks were grouped by altitude. Sample sizes for each altitude were roughly half an hour (six blocks) in the majority of cases, but data are also presented for shorter intervals, in one case that being a single 5-min block.
Results are presented in the graphs below. There is one graph for each of the flights processed: rf02, rf03, rf04, rf07, rf08 and rf09. Average spectra are shown for different altitudes and scatterplots of the LWC comparisons. In addition, a Z-R plot is given. The rf02 graph includes a correction to the PVM data based on the size-dependent response of the PVM probe, as per H. Gerber memo of 9/25/01.
A tabulation of the time segments used, of linear fit parameters and correlation coefficients are in this table.
To the first order, the LWC comparisons are encouraging with reasonably good agreement among the integrated mass and the two direct LWC measurements. Systematic deviation from agreement is most evident for rf04 and, curiously, the PVM and the KLWC-5 data go in opposite directions.
Other deviations are most evident for higher LWC values (most strikingly rf02, rf08 and to a lesser degree rf09), again the two comparisons showing different responses. Some deviation from 1:1 agreement at higher LWC was to be expected due to the known limitations in sensitivities of the probes to larger droplets. In the calculations of the LWC from the combined size spectra, I kept track of the fraction contributed by droplets < 45 mm diameter; that fraction is >0.95 for high LWCs and has some values near 0.85 only for low LWCs, i.e. closer to cloud base. From that one can argue that the deviations from agreement at higher LWC values are not due to incorporation of the full spectrum in the integrated mass calculation.
The dependence on altitude (or time) in rf03 is puzzling. There are groups of 'odd' points in rf07 and rf09. Other people will surely see more points worth commenting.
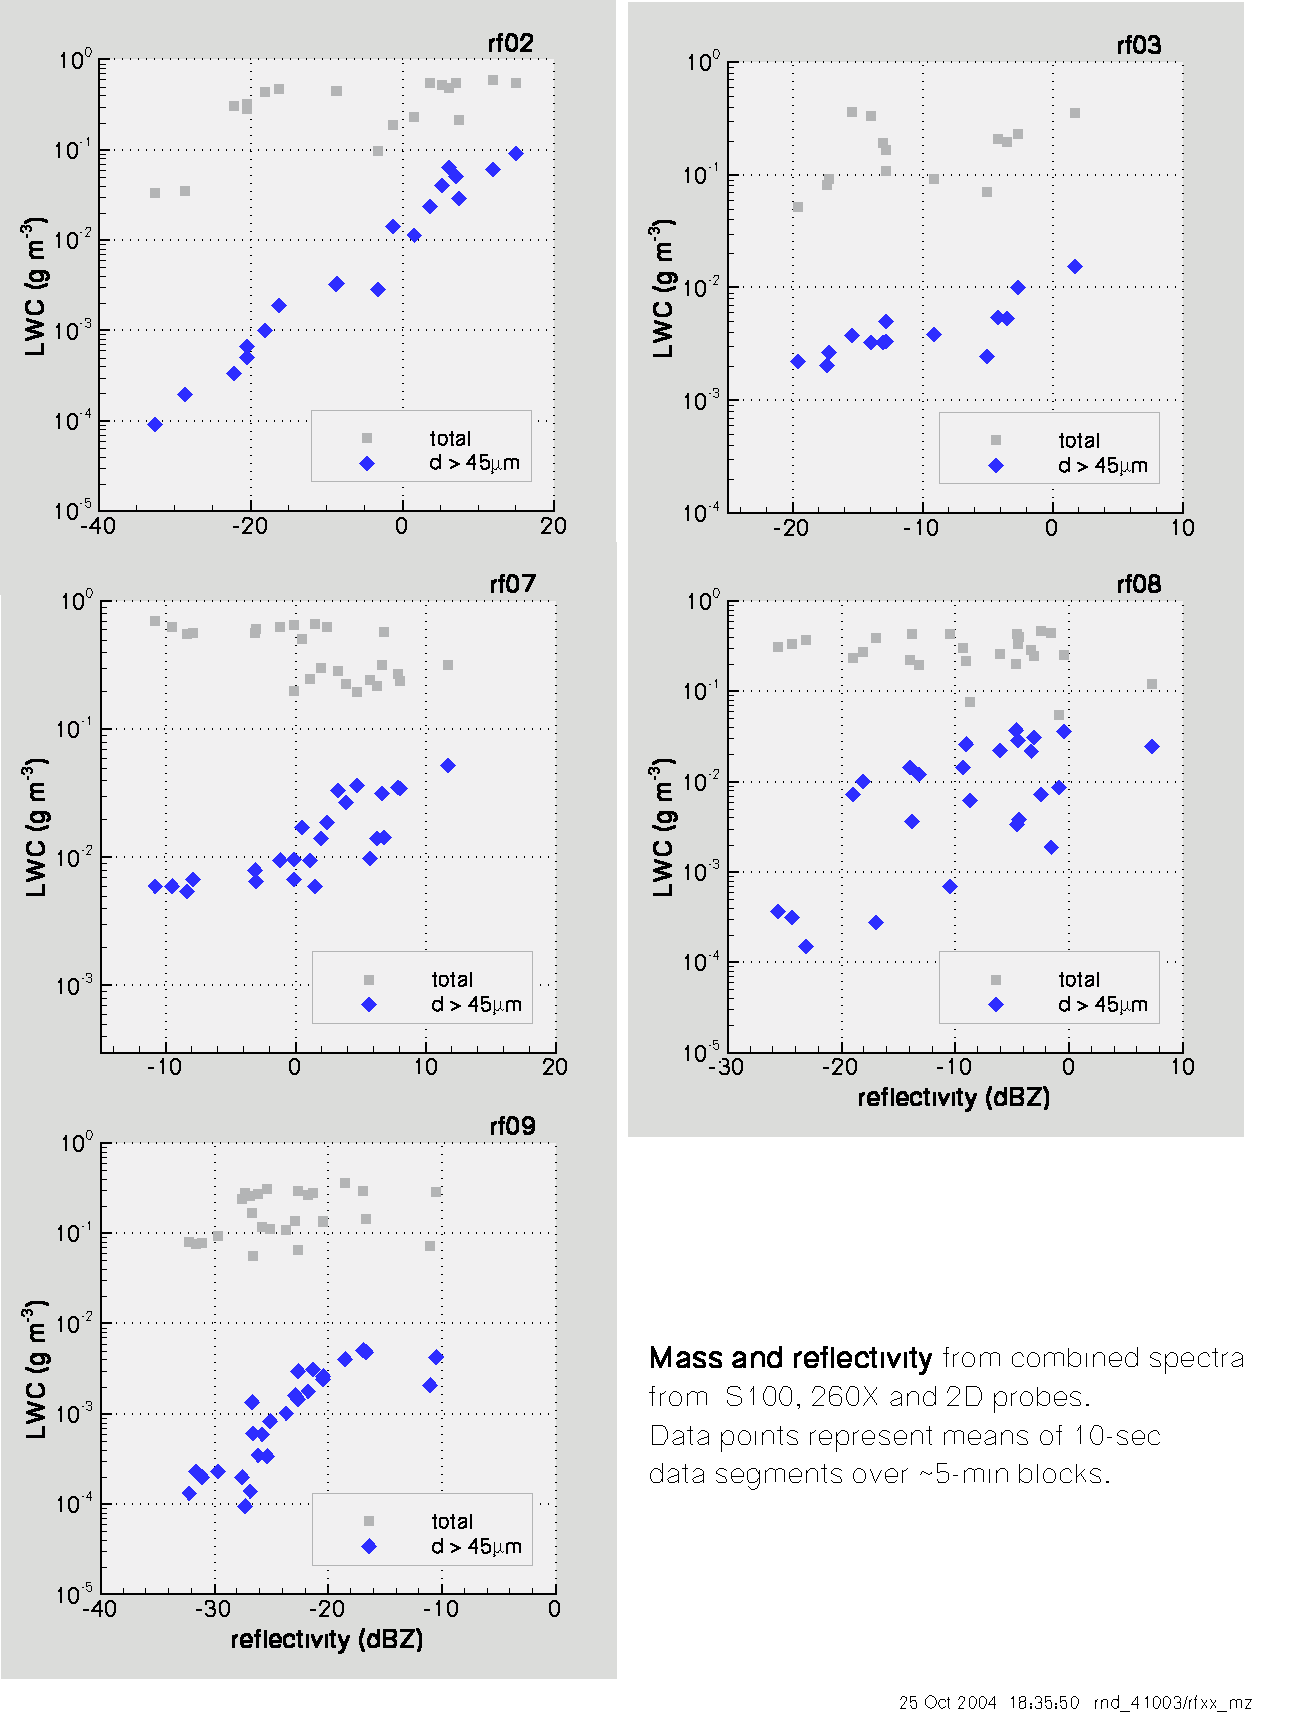
LWC vs. reflectivity plots, using moments of the combined spectra and averages over the 5-min (or similar) periods are given in the graph below. The LWC portion contributed by drizzle drops (defined here as >45 mm diameter) is identified separately here; as expected reflectivity is better correlated with this than with the total LWC.
|
|
The Z-R data will be the subject of another report.
-------------------------------------------------