|
B. Geerts and E. Linacre |
6/'98 |
![]()
Vigorous debate has recently been generated by evidence that the Earth's surface appears to have warmed rapidly during the last two decades, while the troposphere has not. Various records show that the screen-level (1.5 m) air on land and the sea surface have warmed by about 0.2 K since 1979, while the lower troposphere seems to have cooled a little (less than 0.1 K). The latter was discovered only recently (1). This, and the apparent inconsistency of these trends, was sufficient evidence to some sceptics of the greenhouse theory that global warming as a whole was a hoax (2).
The first question to explore then is: how accurate are the measurements? Surface measurements, especially those over land, are considered to be quite reliable, and a warming trend is observed even after removing those stations that may have experienced some local heating to urbanization. Weather balloon data are quite accurate as well, however these measurements are more limited because the network of radiosonde stations is sparse and leaves wide-open gaps, especially over oceans.
|
In the mid-1970's, several polar-orbiting satellites (TIROS-N series) were launched with microwave sounding units (MSUs) on board. These MSUs measure upwelling microwave radiation in various wavelengths. Microwave radiation is emitted and re-absorbed by the various layers of the atmosphere, and the microwave emission is proportional to the brightness temperature of the air (Tb): Tb = e Ta Here e is the emissivity and Ta the air temperature. The atmospheric temperature profile can be deduced from these radiances by means of a complex inversion technique. Considering the indirectness of the technique, and the need to calibrate the MSUs, one may wonder how good the remotely-sensed temperature record is. The accuracy and reliability of MSU temperature data gathered by the satellites has been confirmed by comparing the satellite data to independent radiosonde data. A recent study (1) found a 97 percent agreement between the global MSU data and radiosonde temperatures from 1979 to 1994. In an earlier study (3) an upper air temperature record of 63 daily radiosonde sites around the world indicated a 17-year climate trend of -0.05° C per decade, which was in very good agreement with the satellite data at that time. Continuous MSU data for almost all regions of the Earth, including remote deserts, rain forests and oceans have been available since 1979. While there are more than 1,000 radiosonde launch sites globally, the data from many sites either are not readily available or are not consistently collected. Also, they only measure temperature profiles once or twice a day, at fixed hours. MSU satellites take over 30,000 measurements per day. Clearly the two temperature records are not directly comparable.
|
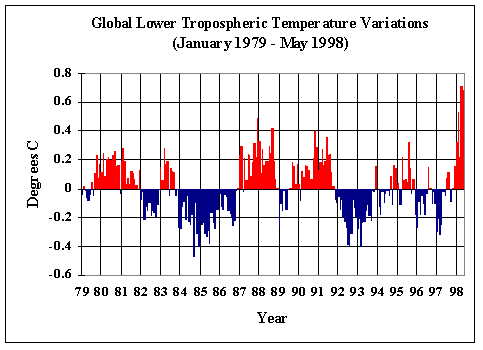
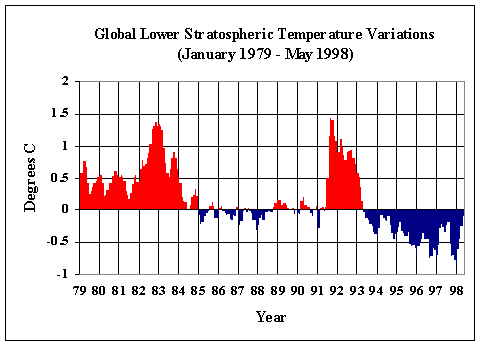
(Source : MSU web site) |
Even so, it seems that the cooling trend seen in the MSU data is excessive. The difficulty in reconciling the information from these different sources has sparked a debate in the climate community about possible instrumental problems and even the existence of global warming. Recently an artificial cooling trend in the MSU-derived temperature series has been identified (4). The correction is due to previously neglected orbital-decay effects. The new, corrected estimate is +0.07K per decade for the MSU-based temperature trend, which is in closer agreement with surface temperatures. They also find that the reported cooling of the lower troposphere, relative to the middle troposphere, is another artefact caused by uncorrected orbital-decay effects.
The corrected MSU temperature data are generally believed to be quite accurate, both globally and regionally. The (uncorrected) lower tropospheric temperature data, above, show very little trend. Some warming is evident during the last 6 months, associated with the '97-'98 El Niño. A clear cooling trend is evident in the lower stratospheric temperature record (right), also derived from the MSU data. This is consistent with GCM (general circulation model) predictions. The apparent warming of the lower stratosphere in 1983 and 1992 are associated with the eruptions of El Chicon and Mt Pinatubo, respectively (Note 2.G). The veil of volcanic dust in the lower stratosphere absorbs solar radiation.
If the data are accurate, then the second question is: can these opposing trends be consistent? This question is best answered by means of GCMs. If GCMs simulate this pattern, it must be consistent in terms of atmospheric dynamics and radiative transfer. Hansen et al. (5) compared i) 1979-1996 surface temperature and tropospheric temperatures with ii) GISS SI95 general circulation model (GCM) patterns of temperature change.
The model is run with six modes of forcing:
For each mode of forcing the atmospheric GCM is run with 4 ocean treatments: (i) observed sea-surface temperatures (decoupled model run), (ii) a Q-flux ocean, (iii) a coupled dynamic GISS ocean, and (iv) a coupled dynamic GFDL ocean. Ensembles of 5 or 10 runs are performed for each combination.
They find that most interannual variability from 1979-1996 in middle and high latitudes is chaotic (unforced), but observed SST anomalies (partly chaotic and partly forced) account for much of the low-latitude variability and some at high latitudes. The model runs confirm that volcanic aerosols (such as those from the Mt Pinatubo eruption) warm the stratosphere and cool the surface. Ozone depletion cools the lower stratosphere, troposphere and surface, steepening the tropospheric temperature lapse rate. The effects of changes in solar irradiance (due to the sunspot cycle) are negligible. Greenhouse gases cause a large surface warming that offsets the cooling by the other three forcings. With an additional disequilibrium forcing of +0.65 W/m2, there is a simulated global surface warming of 0.2 K from 1979-1996, close to observations.
With regard to the lower troposphere, there is some inconsistency between observations and GCM simulations. The authors (5) state that "there are differences in the observed and modelled temperature trends. But there are uncertainties in the observed temperatures, in the radiative-forcing data, and in the climate models, which make it difficult to draw firm conclusions about the apparent differences". A detailed description of the uncertainties in the satellite data and radiative forcing is given. They note that that the radiative forcings used do not cause a cooling of the lower troposphere relative to the upper troposphere, and suggest that the reason may be the exclusion of direct or indirect forcing due to changes in tropospheric aerosols. The most likely cause of such a tropospheric temperature profile is a forcing that causes increased low-level clouds and thus cooling of the lower troposphere.
With regard to the upper troposphere, radiosonde and MSU data do not show any warming trend either. Critics of 'global warming' (6) interpret the observed absence of upper-tropospheric warming as evidence that climate models are flawed: GCMs forced by a doubled CO2 concentration show strong warming in the upper troposphere. They argue that the observed lack of warming (or slight cooling) is an indication of a negative water-vapour feedback. However, the results of Hansen et al (5), obtained with a model that has a strong positive water-vapour feedback and is driven by measured radiative forcings, are consistent with observed temperature change and indicate that ozone depletion has reduced tropopause warming. If this interpretation is correct, during the next 5-10 years, as ozone-depletion levels out and perhaps reverses, warming of the upper troposphere by well-mixed greenhouse gases should become apparent. The model results indicate good agreement with the observed strong cooling in the lower stratosphere (see MSU data above), which is a result of the greenhouse gas accumulation and, secondarily, of the decrease in stratospheric ozone
References
(1) Christy, J.R., Spencer, R.W. and W.D. Braswell, 1997. How accurate are satellite 'thermometers'? Nature, 389, 342.
(2) Robinson, A. and Z. Robinson, 1997: Science has spoken: global warming is a myth. Wall Street Journal, 4 Dec 1997.
(3) Spencer, R.W. and J.R. Christy, 1992. Precision and radiosonde validation of satellite gridpoint temperature anomalies. Part II: A tropospheric retrieval and trends during 1979-90. Journal of Climate, 5, 858- 866.
(4) Wentz, F. J. & M. Schabel 1998. Effects of orbital decay on satellite- derived lower-tropospheric temperature trends Nature 394, 661.
(5) Hansen, J. et al. 1997. Forcings and chaos in interannual to decadal climate change. J. Geophys. Res. 102 (D22), 25679-720.
(6) Robinson, A.B., S.L. Baliunas, W. Soon and Z.W. Robinson, 1998. Environmental effects of increased atmospheric carbon dioxide. Apparently unpublished