Estimating tropical cyclone intensity from satellite imagery

B. Geerts

7/'98


Most tropical cyclones form over remote ocean areas and are detected on satellite imagery. Local wind and/or surface pressure data are needed to estimate the damaging potential of cyclones. The problem faced by forecasters is how to assess the intensity, and even the mere existence, of a tropical cyclone without in situ wind or surface pressure measurements.

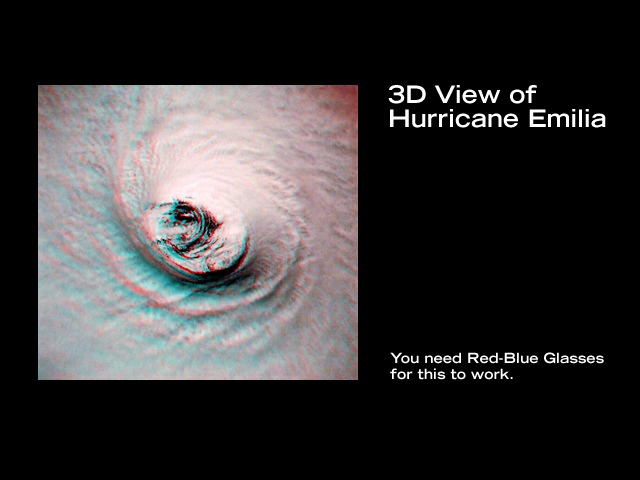
One technique, known as the Dvorak technique (1) (used in the United States), uses digital infrared images from geostationary satellites. The upwelling IR radiation is a measure of the temperature of the cloud top, or, in the absence of clouds, the temperature of the Earth's surface (plus a measure of atmospheric humidity). The more intense a tropical cyclones is, the better-defined, clear, and dry the eye is (due to subsidence), and also the higher the cloud tops above the eyewall. This height difference between the eyewall and the eye is apparent in a stereo-image of a hurricane from space. So, from the perspective of a satellite in space, more intense tropical cyclones have a higher IR 'blackbody' temperature in the eye, and a lower one over the eyewall.

The Dvorak technique estimates the IR temperature difference: it takes the value in the eye, minus the lowest value on a 55 km circle centered around the eye. Dvorak then assigns T-numbers, and a comparison with in situ data (from reconnaissance flights by the Hurricane Hunters) shows a good correlation between T-numbers and observed wind speed. For instance, Atlantic hurricane Pauline measured a T-number 6 on 7 Oct 1997, and this corresponds to maximum sustained surface winds of 59 m/s. According to Table 13.2 in the textbook, this implies a class 4 hurricane.

Fig 1. GOES-8 infrared image of hurricane Pauline at 1215 UTC 8 Oct. 1997. During the following 24 hours this hurricane caused extensive damage in Acapulco, Mexico. Pauline killed 230 people. Almost all died by drowning, as over 400 mm of rain fell in less than 24 hours.

The Dvorak technique is difficult to apply to tropical storms or weak tropical cyclones because a broad cloud anvil often covers the center of the circulation, so it is impossible to define this center from satellite imagery.

There is a good relationship between maximum sustained surface wind speed, minimum pressure and ocean swell. For instance, for an eye pressure of 980 hPa (or rather, 30 hPa below the ambient pressure), the wind at a height of 10 m peaks around 28 m/s, but around 56 m/s if 920 hPa (1). There is some error margin. The correlations perform worse in the case of -

Large cyclones tend to have a much lower central pressure than small cyclones of similar intensity (wind speed). On the other hand, winds have been underestimated in small intense cyclones, and where the motion of a fast-moving cyclones augments wind speeds. When satellite imagery indicates that a cyclone is highly asymmetric, with most of the cold cloud tops on one side of the eye, then the wind field usually is asymmetric as well.


References

(1) Dvorak,V.F. 1984. Tropical Cyclone Intensity Analysis Using Satellite Data. NOAA Tech. Rep. NESDIS 11, 47 pp.

(1) Callaghan, J. and R.K. Smith 1998. The relationship between maximum surface wind speeds and central pressure in tropical cyclones. Aust. Meteor. Mag. 47, 191-202.