Changes in concentration of atmospheric carbon dioxide, other greenhouse gases, and aerosols
|
B. Geerts and E. Linacre |
3/’02 |
![]()
Carbon dioxide
|
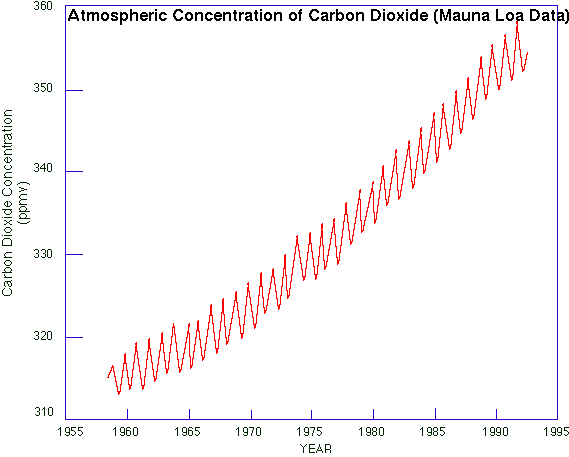
The fundamental reason why scientists are generally confident that we are and soon will be experiencing global warming is because the concentration of carbon dioxide (CO2) has been increasing steadily in the global atmosphere (Fig 1). Unlike water vapour or aerosol, CO2 is well-mixed in the atmosphere and changes are relatively slow. There is an annual cycle, evident in Fig 1 and explained in the book (Section 1.3), but its amplitude is small compared to the trend. (The annual cycle of water vapour concentration is much larger than any trend.) Carbon dioxide is a major greenhouse gas, and even the simplest one-dimensional radiative transfer model predicts surface warming when greenhouse-gas concentrations rise. Other factors affecting climate, such as the direct and indirect effect of aerosols, are much harder to measure, display large variability, and their effect on climate is poorly understood. It is because of these 'other factors' that scientists are not overly confident. Estimates of the atmospheric CO2 concentrations prior to 1958 can be made by analysing the bubbles in ice at different depths in ice sheets, for instance in Antarctica. This analysis shows that there were about 280 parts per million of CO2 in the Earth's atmosphere prior to 1800 AD, at least as far back as 1000 AD (2). |
Fig 1: Atmospheric CO2 concentrations measured at Mauna Loa in Hawaii. Measurements started in 1958 (1). |
|
So the concentration was fairly steady until about 200 years ago, and it started to rise during the industrial revolution. And the surplus CO2 accumulated during the last 40 years is almost twice the surplus built up during the previous 150 years. So during the last two centuries the growth rate has increased. It can be seen from Fig 1 that the recent rate of increase has been fairly steady, but closer inspection reveals slight variations. The rate of increase itself is shown in Fig 2. The rate was about 0.7 ppm annually in the early 1960's, but it had more than doubled by 1994. There was a decline from 1.7 ppm/a around 1987 to 1.3 ppm/a five years later (possibly due to high oil prices in the early 1980's), but a renewed increase since then. More recent evidence suggests that that this renewed acceleration is short-lived, and that the growth rate now is steady around 1.6 ppm/a. Many developed countries, especially in Europe, have stepped up measures to reduce fossil-fuel consumption and any other industrial/agricultural processes that contribute to greenhouse gas emissions. But overproduction of fossil fuels, especially oil, has thwarted conservation efforts. |
Fig 2: Annual growth rate of atmospheric CO2 concentrations at Mauna Loa (3). |
The rate of CO2 increase appears to be slowed after El Niño events, such as the 1982-3 and the 1997 events (4). This is presumably because the global mean temperature is slightly higher during El Niño years, and therefore plants grow more prolifically, especially at boreal latitudes. This implies more CO2 uptake by the biosphere. It is not clear, however, why there is a two-year gap between the El Niño event and the reduction of atmospheric CO2 growth rate. A key factor is the rate of uptake by the ocean.
Other greenhouse gases
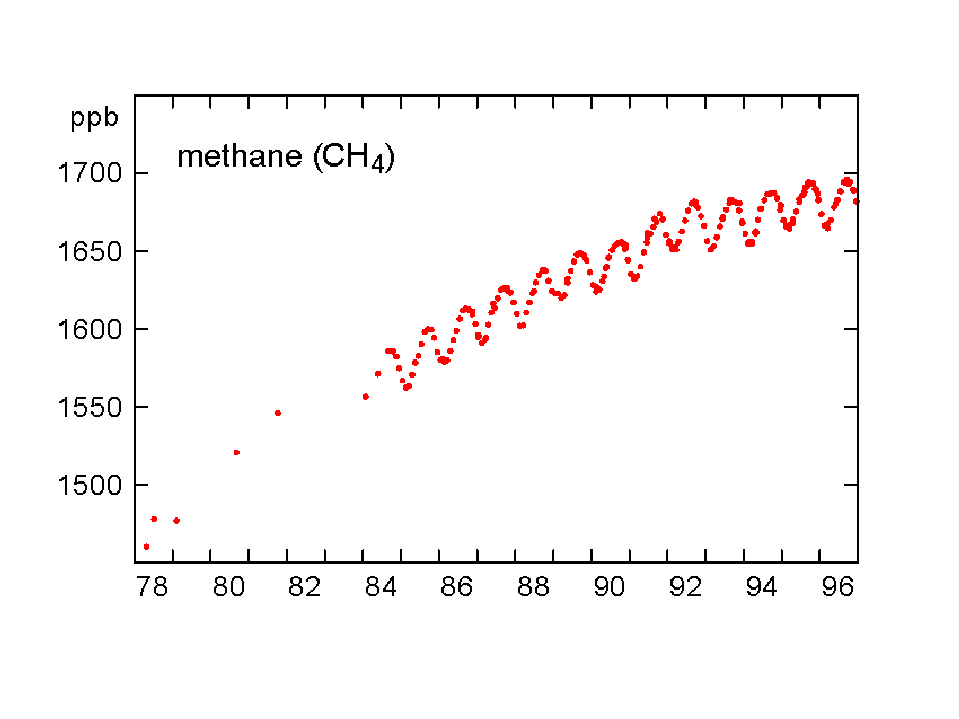
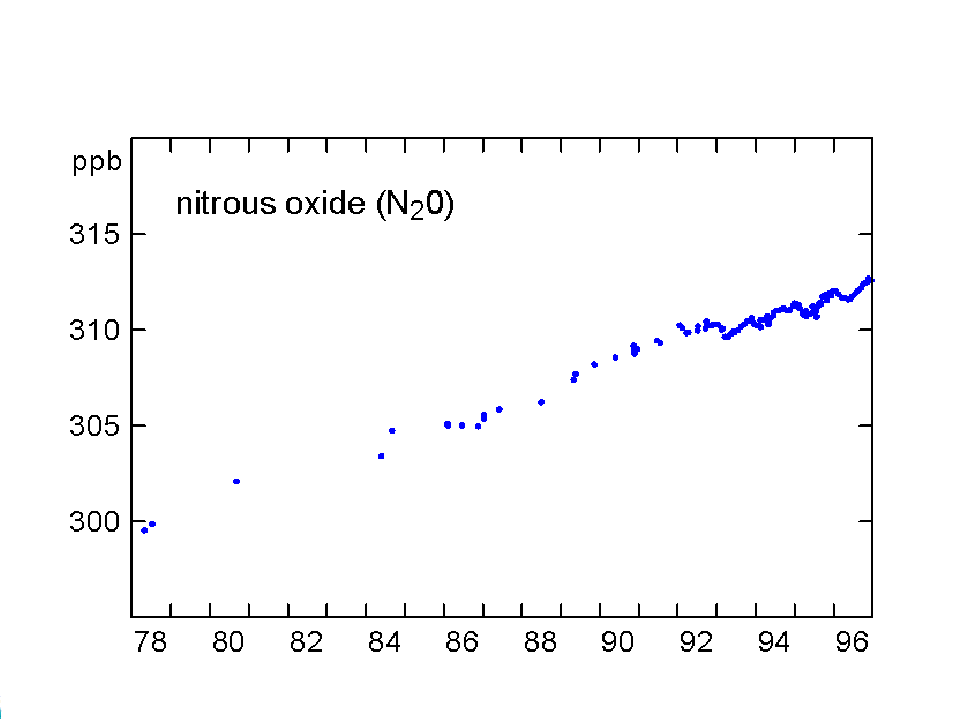
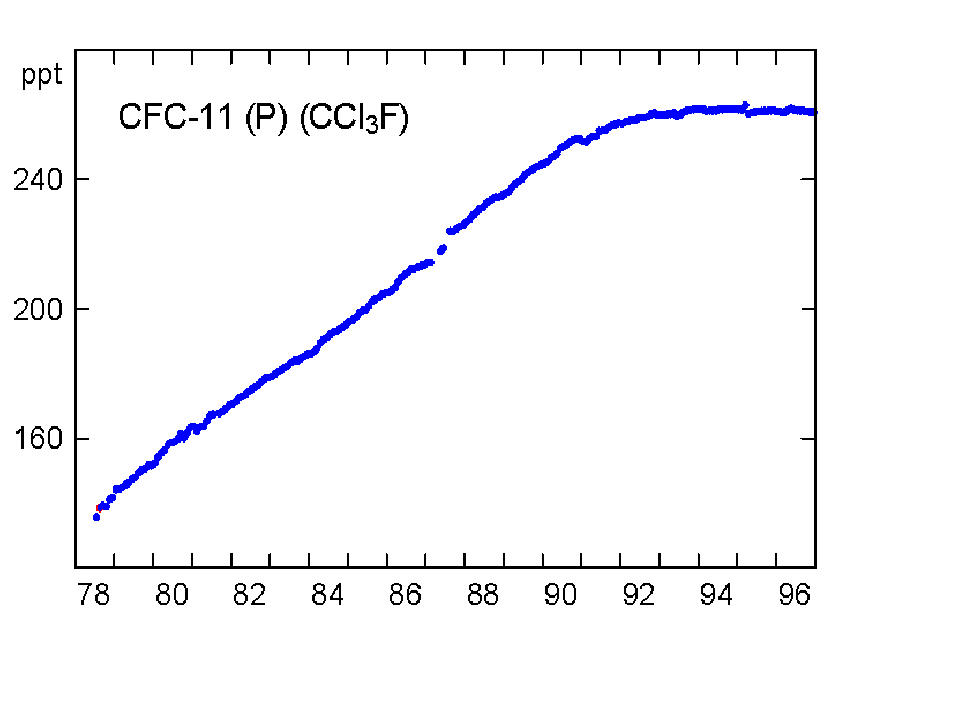
The concentration of CO2 has increased by about 30% since the beginning of the industrial revolution (between 150-1992). By comparison, two other atmospheric gases of major importance in greenhouse warming (apart from water vapour, which is dominant), methane (NH4) and nitrous oxide (N2O) have increased by about 145% and 15% respectively. The present concentrations lead to enhanced radiation to the ground by 1.56 W/m2 from the CO2, 0.47 from NH4 and 0.14 from the N2O (5). Chlorofluorocarbons did not exist before 1950, and their current concentrations enhance surface radiation by about 0.10 W/m2. During the last quarter of the 20th century the growth of CFC-11 has ceased, whereas nitrous oxide concentrations continue to rise unabated (Fig 3).
Fig 3. Changes in concentration of methane, nitrous oxide and CFC-11 at Cape Grim, Tasmania between 1978-96 (Source: CSIRO).
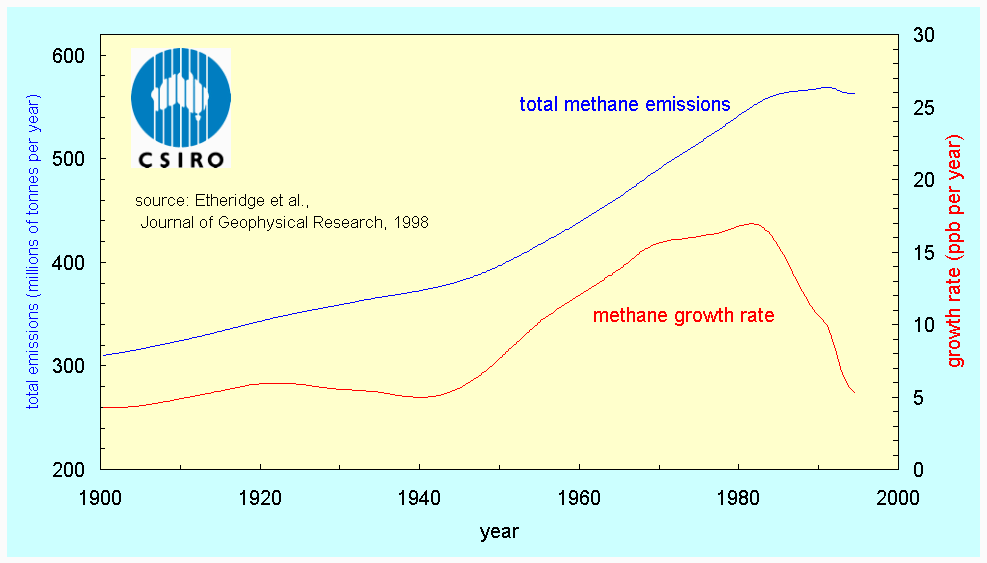
The rate of increase of methane has been largest, which is especially important since a NH4 molecule has 25 times the capacity of a CO2 molecule to trap heat in the atmosphere. The pre-industrial methane concentration was 0.75 ppm and the 1997 level was 1.73 parts per million. The main culprit for its growth appears to be agricultural activities, in particular rice cultivation (anaerobic decomposition in paddies) and boviculture (enteric fermentation). More recently (1983-1995), the NH4 growth rate appears to have declined, particularly in the northern hemisphere (6). This is because emissions have decreased considerably since 1982 (Fig 4). It is not clear why this is the case.
There was also a slowdown in the rate of increase of nitrous oxide (N2O) in 1992, compared with 1985-91. Both natural and plowed soils are an important but highly variable source of CO2, CH4, and N2O, depending on soil moisture, temperature and fertilisers.
Fig 4. Changes in methane emissions (blue) and atmospheric methane concentration (rate of change, in red) at Cape Grim (source: 7)
Aerosols
An argument against the idea that global warming is due to mankind's emissions of carbon dioxide goes as follows: the warming this century occurred mostly between 1910 and 1940, when the carbon dioxide concentration grew slowly from 293 to 300 ppm. On the other hand, the temperature remained steady between 1940-1980, while the carbon dioxide concentration increased from 300 to 335 ppm. The most likely answer to this inconsistency is atmospheric aerosol. Aerosols are emitted by industrial processes, transport, etc, and their increased concentration offset simultaneous warming due to increasing greenhouse gases. However the warming overtook the cooling by mid 1970's (8).
Tropospheric aerosols reduced solar radiation to the ground by about 0.5 W/m2, as a global average, between 1940-1992 (5). Unlike greenhouse gases, which are generally long-lived, aerosols fall out of the atmosphere fairly rapidly, either dry ('sedimentation') or within rain (as condensation nuclei). Therefore aerosol concentrations are not uniformly mixed across the globe. They have been so high in some regions that the cooling effect may have exceeded the warming due to greenhouse gases. In fact the lack of warming between 1940-1980 is only found in the northern hemisphere, where most manmade aerosols are emitted.
Manmade aerosols include soot and sulphur dioxide emitted by coal burning plants, for instance. The Mt Pinatubo eruption in the Philippines in 1991 produced 30m tonnes of SO2 in a few hours, almost twice as much as the entire USA produces in a year. The cooling effect could be felt for the following two years.
References
- Halpert, M.S. and G.D. Bell, 1997: Climate assessment for 1996. Bull. Amer. Meteor. Soc., 78, 1-49.
- Houghton, J.T., L.G. Meira Filho, B.A. Callander, N. Harris, A. Kattenberg and K. Maskell, 1996: Climate Change 1995: The Science of Climate Change.Contribution from the Working Group I to the Second Assessment Report of the Intergovernmental Panel on Climate Change. (Cambridge Univ. Press) 572pp.
- Schimel, D. et al. 1996. Radiative forcing of climate change. In (2) Houghton et al. 1996, 65 -131.
- Braswell, B.H., D.S. Schimel, E. Linder and B. Moore, 1887: The response of global terrestrial ecosystems to interannual temperature variability. Science, 278, 870-872.
- Weir, A. 1996. IPCC second assessment. Climate Change Newsletter (Aust. Dept Primary Industries & Energy), 1-4.
- Hengeveld, H. and P. Kertland 1995. An assessment of new developments relevant to the science of climate change. Climate Change Newsletter (Australian Bureau of Resource Sciences, Canberra), 7, August, 24p.
- Etheridge, D.M., L.P. Steele, R.J. Francey, and R.L. Langenfelds, 1998. Atmospheric methane between 1000 A.D. and present: evidence of anthropogenic emissions and climatic variability. J. Geophys. Res., 103, 15979 - 93.
- Keeling R. et al. 1996. Nature, 381 , 218.
